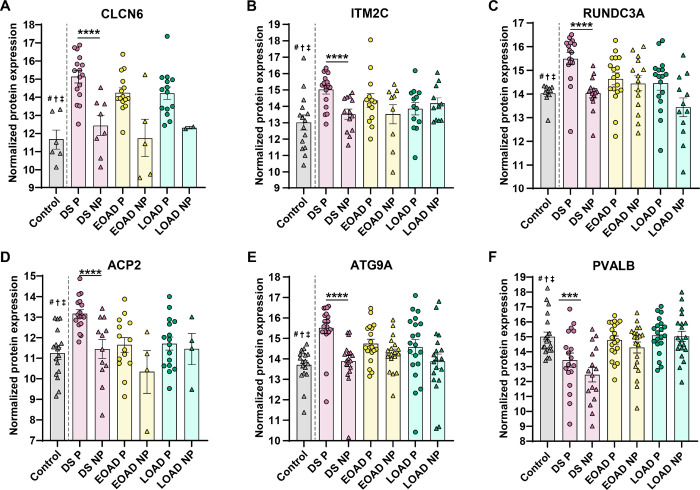
Figure 6.
Enriched Aβ plaque proteins of interest in DS compared with EOAD and LOAD. (A-F) Normalized protein expression obtained from the label-free quantitative mass spectrometry proteomics of abundant Aβ plaque proteins of interest in DS. Proteins are shown by order of decreasing significance. Proteins of interest were defined as significant (FDR < 5%, fold-change > 1.5) only in DS and also have known or predicted roles in AD and DS. Pairwise comparisons p values are indicated. * p<0.05, **** p<0.0001. Error bars indicate standard error of the mean (SEM). Significant pairwise comparisons are indicated for those analyses that were performed, controls are shown as reference. # † ‡ indicate that the given protein is not significantly abundant in non-plaque AD tissue compared to controls in DS, EOAD and LOAD, respectively.

