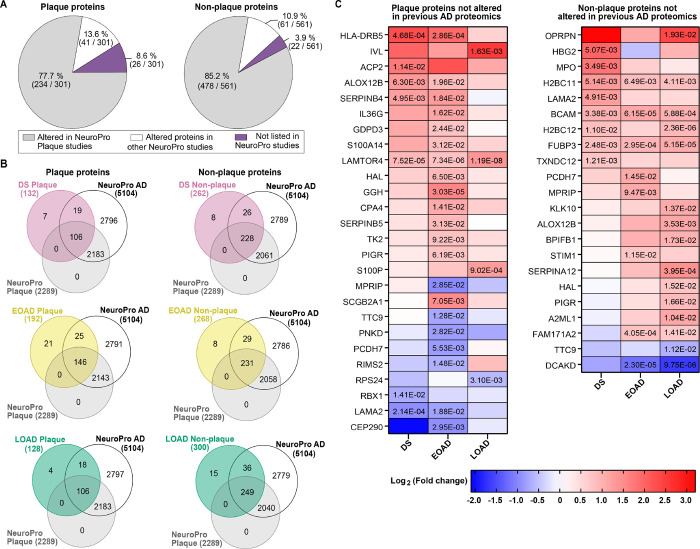
Figure 7.
Comparison of protein changes with previous advanced AD proteomics studies. A. Altered proteins identified in the current study were compared with proteins found altered in previous AD proteomics compiled in NeuroPro (35) (v1.12; https://neuropro.biomedical.hosting/). Pie charts show that 77.7% (234/301) of altered plaque proteins in the present study have been identified in previous AD plaque proteomics studies (gray). 13.6% (41/301) of the proteins have been seen only in bulk tissue proteomics studies (white), and 8.6% (26/301) of the altered proteins observed in the current study have not been described in previous AD proteomics (purple). In a similar fashion, 85.2% (478/561) proteins altered in AD non-plaque tissue have been observed in AD plaque proteomics, 10.9% (61/561) only in bulk tissue proteomics and 3.9% (22/561) have not been described in previous AD proteomics studies. B. Venn diagrams illustrate the altered proteins identified in Aβ plaques and AD non-plaque tissue for each AD subtype evaluated, in comparison to the 5104 altered proteins in advanced AD registered in NeuroPro database. C. Heatmaps depicting the fold change (Log2 [FC]) of the plaque and AD non-plaque altered proteins identified in the present study that have not been described in previous AD proteomics. Numbers in the cells represent the significance (FDR < 0.05) values observed in the pairwise comparisons.

