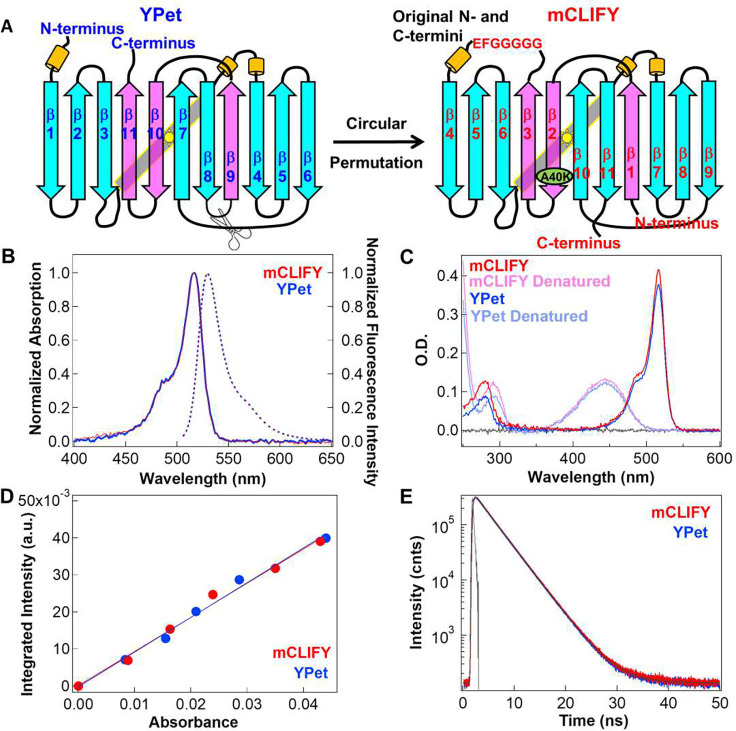
Figure 1: Fluorescent protein design, spectral and photophysical properties.
(A) Design: Cartoon illustrating the circular permutation of YPet via severance of the loop between β- strands 8 and 9 to create new and less compliant N- and C- termini and ligating the original N- and C-termini with 7 a.a. to construct mCLIFY. The β- strands in cyan (residue 1–174) and pink (residues 175–245) specify the sequences that are reordered. The point mutation A40K to disrupt dimerization in mCLIFY is shown in green. The yellow cylinders represent alpha helices. (B) Spectral Properties: Absorption (solid line) and emission (dashed line) spectra of mCLIFY (red) and YPet (blue). Samples were excited at 488 nm to measure the emission spectra. (C) Extinction coefficient measurement: Absorbance spectra of mCLIFY and YPet under native (dark red and blue) and denatured (pale red and blue) conditions (Methods). (D) Quantum yield: The fluorescence intensities for mCLIFY (red) and YPet (blue) integrated from 500–700 nm ploted against the protein’s absorbance. Quantum yeild was calcuated from the slope of the linear regression line. (E) Time-resolved fluorescence decay of mCLIFY (red) and YPet (blue) fitted using two exponentials.

