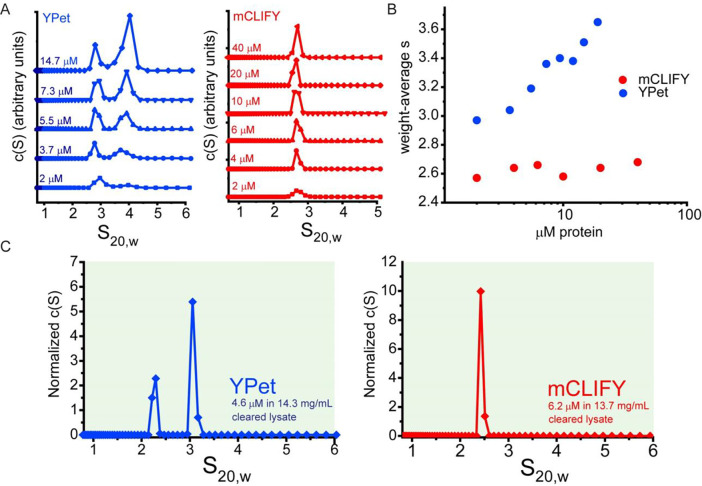
Figure 3: Sedimentation velocity-analytical ultracentrifugation of mCLIFY and YPet in vitro and in bacterial lysate.
(A) Sedimentation coefficient distributions c(S) derived from SV-AUC data of a range of concentrations for both YPet (blue line with points) and mCLIFY (red line with points). (B) Plot of signal-weighted average S (sw) as a function of loading concentration, in μM monomer. Values for mCLIFY (red) and YPet (blue) at each concentration were derived from integration of the c(S) distributions shown in (A), illustrating the concentration-dependent behavior of YPet, which contrasts to the relatively consistent sw determined for mCLIFY across a range of concentrations. (C) SV-AUC data at 515 nm detection were collected on bacterial lysates containing expressed YPet (4.6 μM YPet in 14.3 mg/mL cleared bacterial lysate (blue)) or mCLIFY (6.2 μM mCLIFY in 13.7 mg/ml cleared bacterial lysate (red)).

