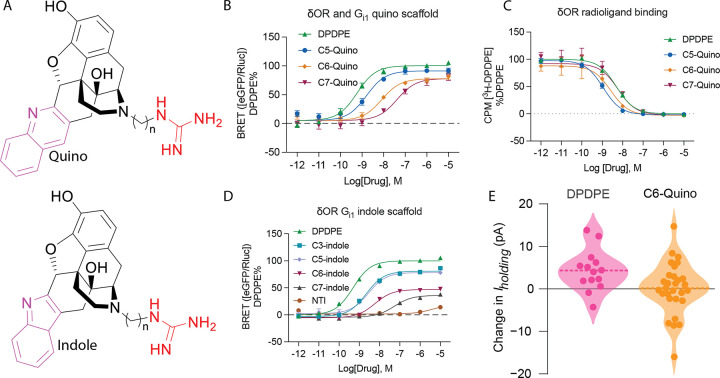
Figure 2. Profiling the signaling of C5, C6, and C7 analogs.
(A) General structures of Quino and Indole scaffolds. (B) Gai-1 signaling of C5, C6, and C7 quino analogs at δOR using TRUPATH BRET assays. Ligand efficacy can be modulated through the allosteric site and is dependent on linker. Potency and efficacy values are shown in Table S3. (C) Radioligand binding of Quino compounds with different linker lengths. Figures contain data ± SD grouped from three independent biological replicates. Quantification of data can be found in Table S4. (D) Gai-1 signaling of C3, C5, C6, C7 indole analogs, and NTI at δOR using TRUPATH Gαβγ biosensors. Potency and efficacy values are shown in Table S11. Figures contain data ± SEM grouped from three independent biological replicates. Efficacy and potency values are summarized in Table S3.E) Summary of whole cell electrophysiological recordings from neurons in the ventral tegmental area (VTA) of acute rat brain slices, showing partial agonism of C6-Quino.

