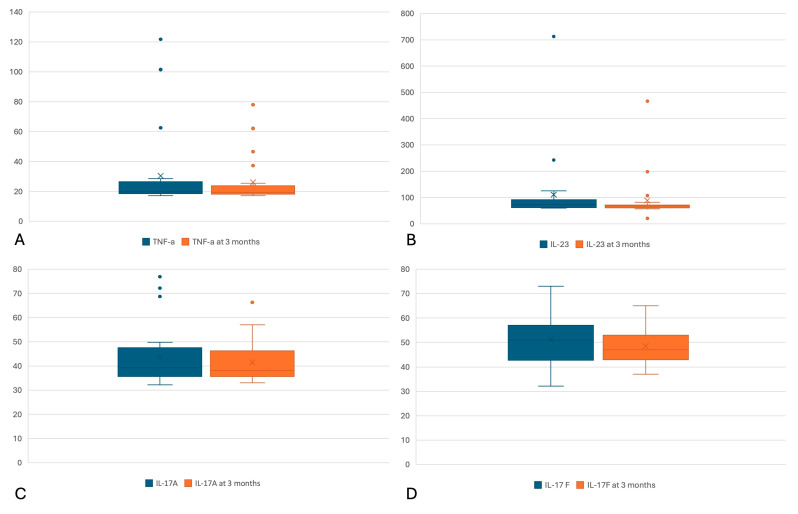
Figure 2.
Box plot graphs for (A) serum level of tumor necrosis factor alpha (TNF-α) at the start of biological therapy (blue), respectively, and at 3 months of treatment (orange), respectively. According to the Wilcoxon signed rank test, the differences between the 2 measurements showed a trend towards significance (p = 0.068 < 0.1). Ordinate: TNF-α level in pg/dL; (B) serum level of interleukin 23 (IL-23) at the start of biological therapy (blue), respectively, at 3 months of treatment (orange). According to the Wilcoxon signed rank test, the differences between the 2 measurements were statistically significant (p < 0.000). Ordinate: level IL-23 in pg/dL; (C) serum level of interleukin 17A (IL-17A) at the start of biological therapy (blue), respectively, at 3 months of treatment (orange). According to the Wilcoxon signed rank test, the differences between the 2 measurements were insignificant (p = 0.417). Ordinate: level IL-17A in pg/dL; (D) serum level of interleukin 17F (IL-17F) at the start of biological therapy (blue), respectively, at 3 months of treatment (orange). According to the Wilcoxon signed rank test, the differences between the 2 measurements showed a trend towards significance (p = 0.098 < 0.1). Ordinate: IL-17F level in pg/dL. Dots represent outliers.

