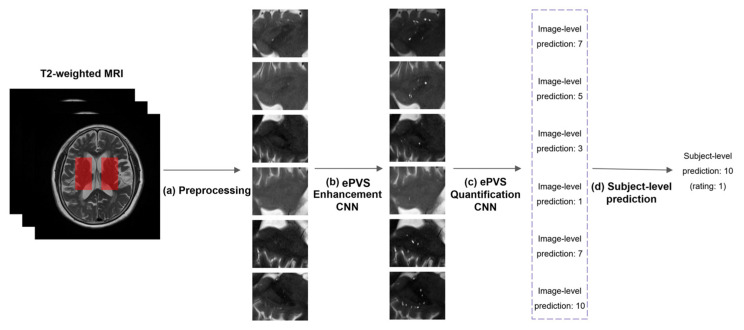
Figure 1.
The flowchart for a deep cascade of CNNs for the assessment of ePVS at image level and subject level. (a) Preprocessing. Six 2D images were extracted from T2-weighted MRI in the left and the right basal ganglia regions across three slices. Each 2D image was resized and normalized. (b) ePVS enhancement CNN. The 2D image was enhanced to have a clear visibility of ePVS using CNN. (c) ePVS quantification CNN. The number of ePVSs from the enhanced image was predicted using a CNN (image-level prediction). (d) Subject-level prediction. The maximum operation is applied to the 6 predicted values for each subject.

