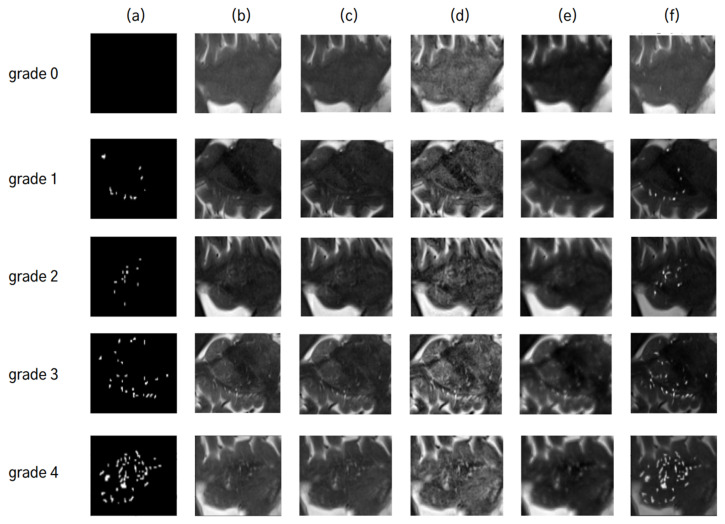
Figure 6.
Comparative analysis of ePVS quantification using different image enhancement techniques: (a) represents the ePVS segmentation mask, (b) is the non-enhanced image, and images (c–f) are enhanced using Tophat, Clahe, Laplacian, and deep learning techniques, respectively. For each grade from 0 to 4, the predicted grades by each technique are as follows: For grade 0, a predicted grade of ‘1’ is obtained from non-enhanced image (b) and images enhanced by techniques in Tophat (c), Clahe (d), and deep learning (f), whereas a predicted grade of ‘2’ comes from Laplacian (e). For grade 1, a predicted grade of ‘1’ comes from (c,f), while a predicted grade of ‘2’ is given by (b,d,e). For grade 2, a predicted grade of ‘2’ is common among (b,d–f) with an exception for (c) predicting a lower grade of ‘1’. For grade 3, (b,e,f) predict an accurate grade of ‘3’, while others predict it as lower at ‘2’. For grade 4, only the enhanced image using deep learning (f) predicts this highest level accurately with ‘4’.

