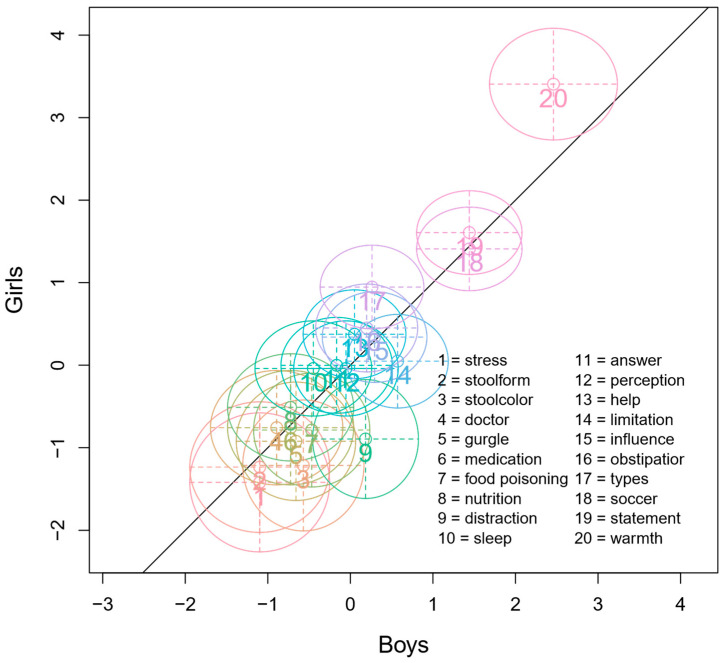
Figure 1.
Visualization of Andersen’s Likelihood-Ratio Test (LRT) with a sample split by gender. On the x-axis, item parameters for boys are displayed, while the y-axis presents item parameters for girls. Zero indicates average difficulty, with items below zero being easier and those above being more difficult. The diagonal indicates parameter equality for girls and boys. Circles around items show confidence intervals (CI). CI’s overlapping with the diagonal indicate well-fitting items with high probabilities of parameter equality across groups. Notably, item 9 (‘distraction’) is significantly easier for girls than for boys.

