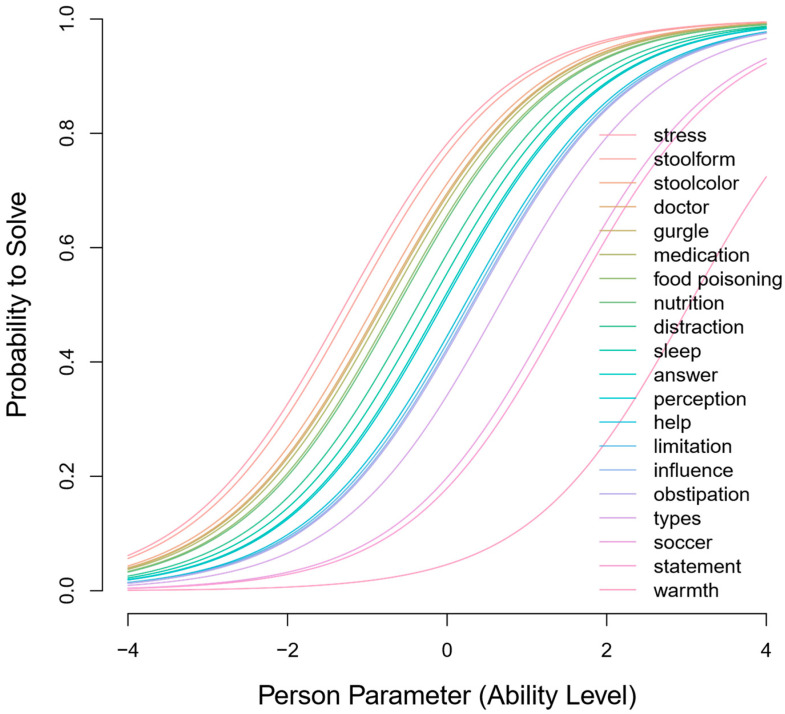
Figure 2.
Item characteristic curve for the A-PKQ child version. The ICCs demonstrate the probability of answering an item correctly (y-axis) based on the person’s ability (x-axis). Negative values on the x-axis indicate lower ability, while positive values indicate higher ability. The difficulty of each item in the child A-PKQ is depicted in an individual ICC. Item names and colors are listed in the legend.

