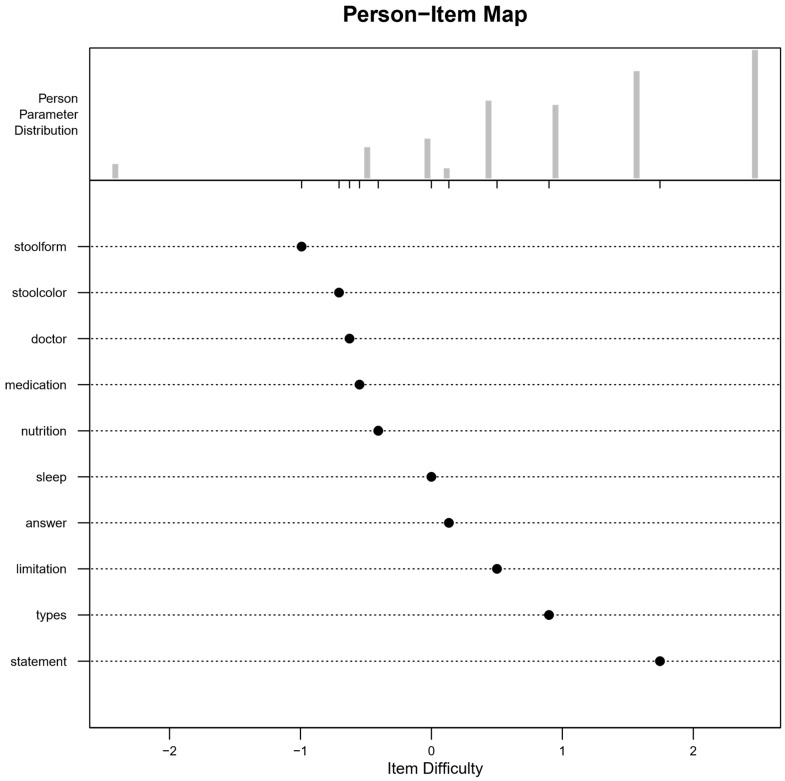
Figure 3.
Person-item map of the final version of the child A-PKQ items. The x-axis denotes item difficulty and is adjusted to the range of individual abilities (−2 to 2). Five items are positioned below zero on the x-axis, indicating that patients with lower abilities also have a higher probability of solving this item correctly compared to items above zero. Two items are located around zero and are therefore suitable to identify patients with average ability. Three items are located above zero and are more likely to be answered correctly by patients with higher ability compared to patients with lower ability. The person parameter distribution reveals that the sample had generally high patient ability.

