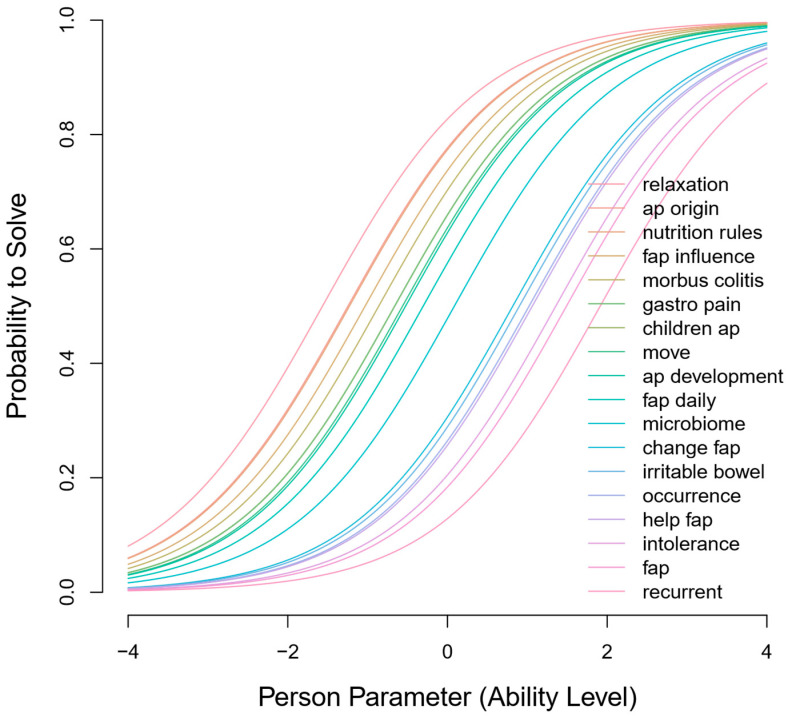
Figure 4.
Item characteristic curve of A-PKQ Parent version. The ICCs demonstrate the probability of answering the item correctly (y-axis) given the person’s ability (x-axis). Negative values on the x-axis indicate lower ability, while positive values indicate higher ability. The difficulty of each item of the parent A-PKQ is represented by an individual ICC. The item names and colors are listed in the legend. For the overlapping items ‘children ap’ and ‘gastro pain’, item names are sequentially listed in the legend, with the color of ‘children ap’ prominently displayed.

