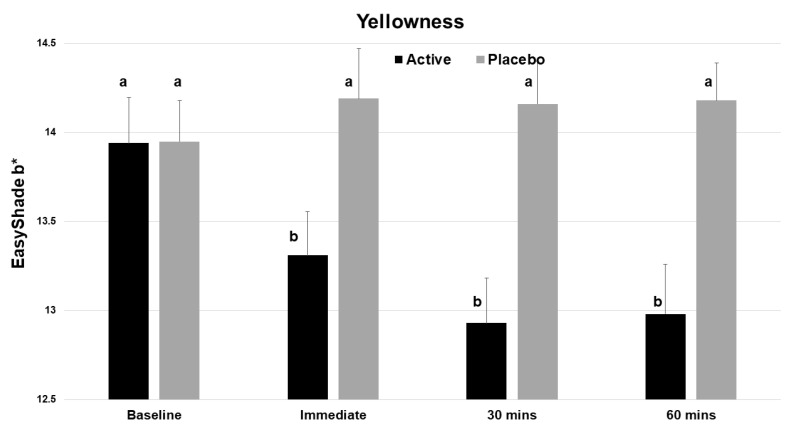
Figure 4.
Vita EasyShade Advanced 4.0 spectrophotometer (VES) readings for b* (yellowness), showing a reduction in yellowness across the 4 time points for the active product (V34CC) but not the placebo. Bars show mean values and standard errors. The letter a shows groups that are not different from the baseline. Groups with the letter b are significantly different from the baseline (p < 0.001) but not different from one another.

