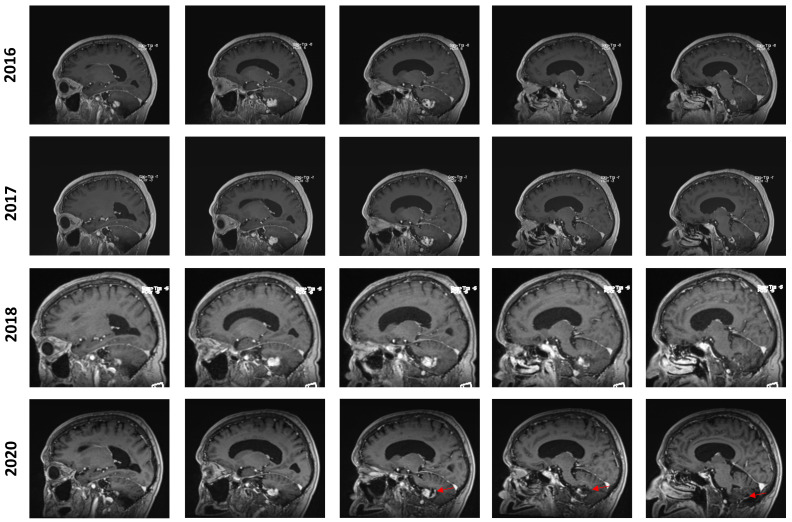
Figure 2.
Longitudinal follow-up. Representative capture of sagittal T1-weighted MRI control imaging. The date of imaging is represented. Images are organized left to right and represent a left–right progression in the sagittal plane. The red marker highlights the appearance of an enlarging cystic component in the posterior aspect of the lesion in 2020.

