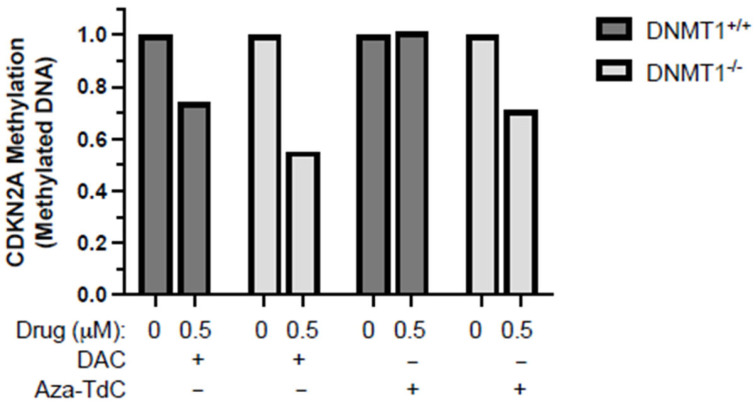
Figure 2.
CDKN2A promoter demethylation by DNMTi in HCT116 DNMT1+/+ and DNMT1–/– cells. Shown here is the methylated CDKN2A promoter level after exposure to 0.5 μM of decitabine and aza-T-dCyd, as indicated, for 72 h relative to the control. DAC, decitabine. The samples were assayed in triplicate, with at least three independent experiments, and the data above are shown as the ratio of the average methylated DNA in the drug-treated sample compared to the control in a representative experiment.

