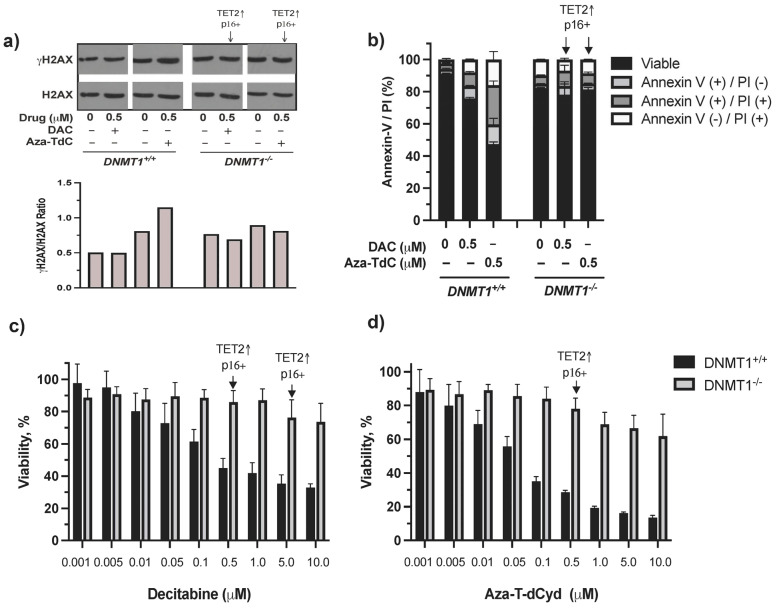
Figure 3.
DNA damage, apoptosis, and cytotoxic effects of DNMTi on HCT116 DNMT1+/+ and DNMT1–/– cells. (a) γH2AX expression and quantitation after treatment with decitabine and aza-T-dCyd for 24 h. (b) Apoptosis induced by 0.5 μM DNMTi after treatment for 96 h. (c) Cytotoxic profiles produced by decitabine. (d) Cytotoxic profiles generated by aza-T-dCyd. Arrows indicate the doses that induced TET2 and p16ink4A and/or p15ink4B in DNMT1–/– cells. DAC, decitabine.

