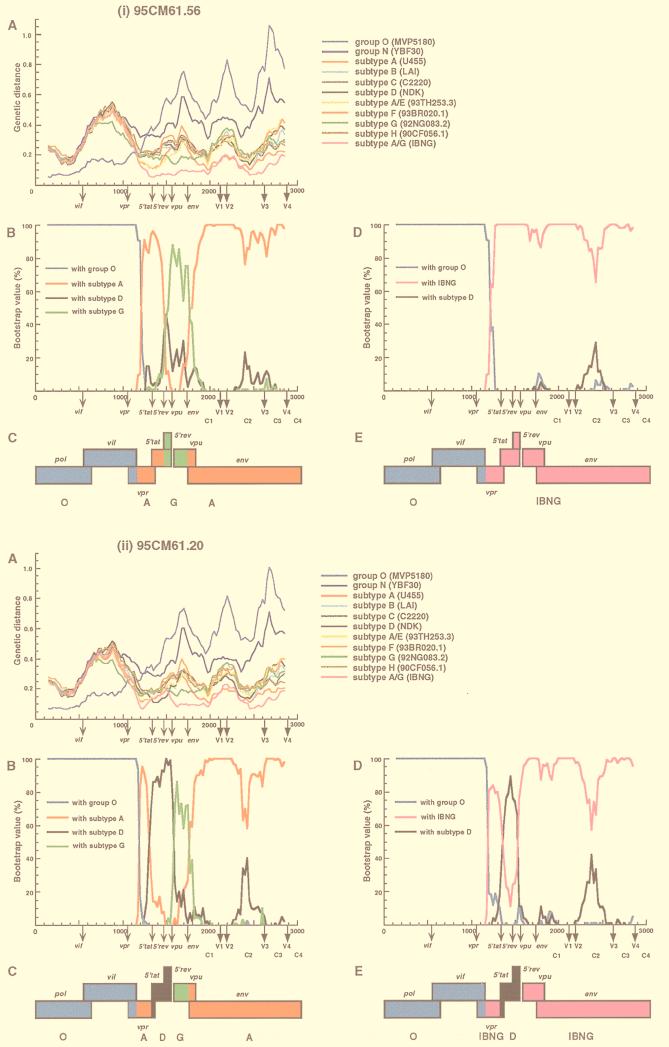
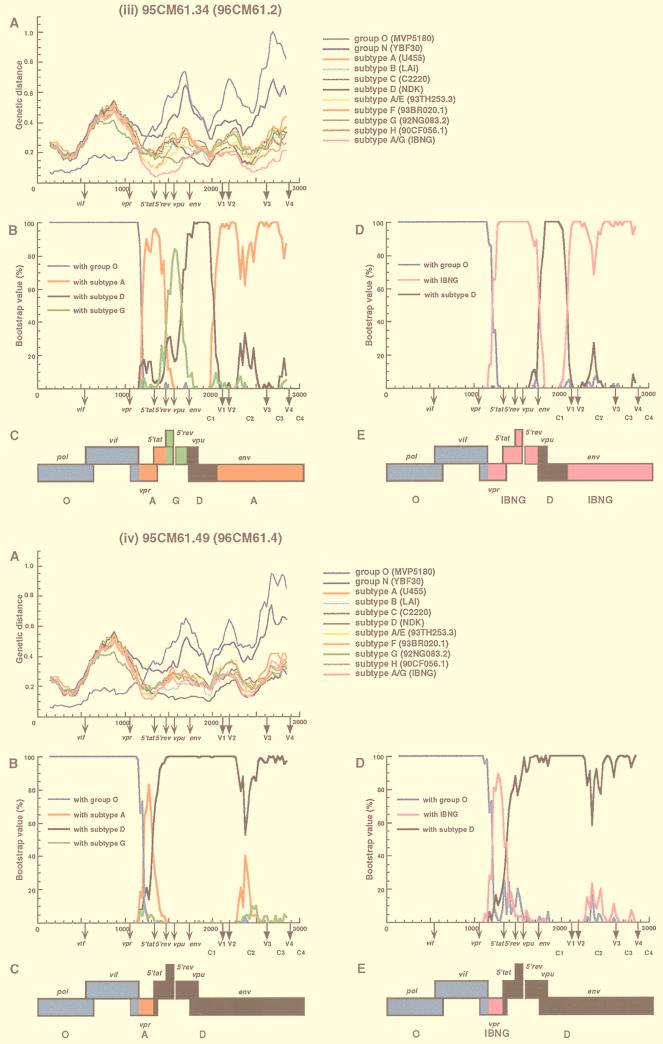
FIG. 2.
Analysis of mosaic structures of four types of 95CM61. (A) Each of four respective clones (95CM61.56, 95CM61.20, 95CM61.34, and 95CM61.49) was aligned with 11 full-length HIV-1 isolates (MVP5180, YBF30, U455, LAI, C2220, NDK, 93TH253.3 93BR020.1, 92NG083.2, 90CF056.1, and IBNG) representing groups O and N, subtypes A to H, and A/G recombinant, respectively, and the alignment was sectioned into 300-nt segments, which were moved in steps of 25 nt. The genetic distances between 95CM61 and the respective reference strains were calculated by using the six-parameter method. (B) Breakpoints were fine-mapped by using a five-sequence alignment consisting of 95CM61, U455, NDK, 92NG083.2, and MVP5180. Bootstrap values for the node with either subtype A, subtype D, subtype G, or group O out of 100 bootstrap replications built by the neighbor-joining method were plotted. (D) Because IBNG is known to represent a mosaic of subtypes A and G, breakpoints were then fine-mapped by using a four-sequence alignment consisting of 95CM61 and putative parental strains (IBNG, NDK, and MVP5180), and the magnitude of the bootstrap value supporting the clustering of 95CM61 with IBNG (A/G), subtype D, or group O was plotted, respectively. The distance value (A) and the bootstrap value (B and D) for each segment were plotted at the midpoint of the segment. (C and E) A map of the open reading frames in part of the HIV-1 genome is shown. Segments derived from group O (blue), subtype A (red), subtype D (black), subtype G (green), and an IBNG-like virus (pink) were mapped by the results of diversity and bootstrap plots, as well as phylogenetic tree analyses.


