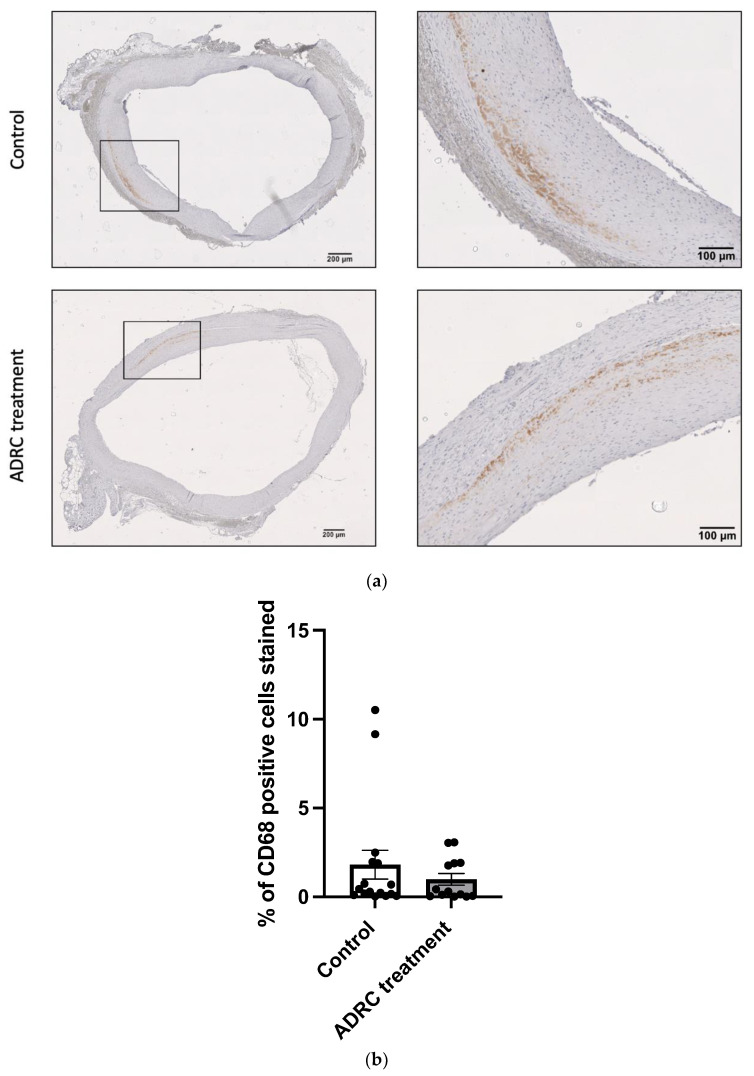
Figure 4.
Infiltrating macrophages into the aneurysmal wall. (a) A representative micrograph of CD68 staining from aneurysmal tissue in the control and the ADRC-treated group. (b) Percentage of CD68 cells’ positive stained area (n = 16/13). Each dot represents the quantification of the individual rats. Values are presented as mean ± standard deviation.

