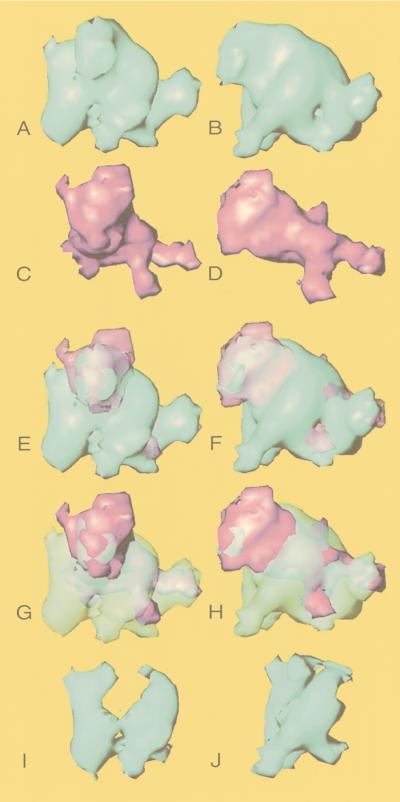
FIG. 6.
Localization of VP19C and VP23. A computationally averaged (see Materials and Methods) triplex (blue) and an averaged VP19C connection (magenta) are shown from a front (A and C) and a side (B and D) view. The two structures are shown superimposed in the same orientations in panels E to H. For each pair of images, either the VP19C (E and F) or the triplex (G and H) density is shown in semitransparency to allow the position of the other structure to be seen. The densities thought to represent the two molecules of VP23 (I and J) were computationally isolated from the difference map between the triplex and the VP19C connection.

