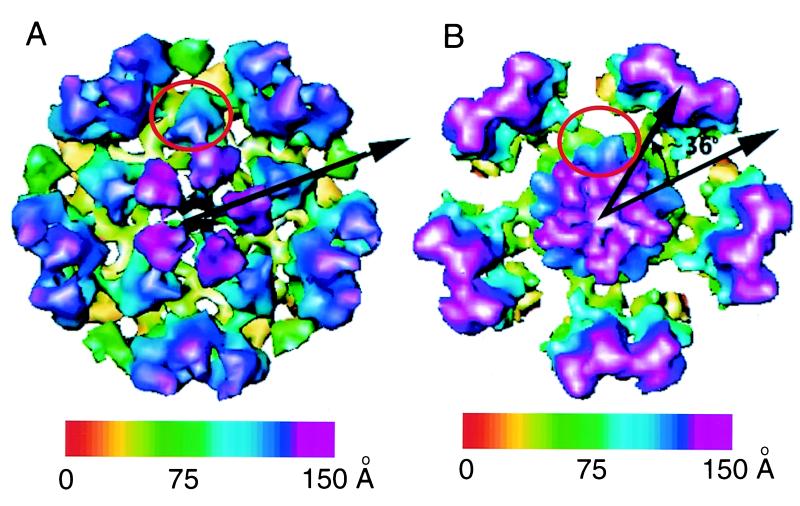
FIG. 7.
Comparison of pentons in VP26− capsids and VP5-VP19C particles. Outer views of the penton environment in VP26− capsids (A) and VP5-VP19C particles (B) are shown. The red circle highlights the position of a triplex in panel A. An additional mass present on the side of the penton in the VP5-VP19C particle that may represent a molecule of VP19C is circled in panel B. The arrow in panel A indicates the alignment of a single VP5 subunit with respect to the neighboring hexons. The pair of arrows in panel B indicates the apparent rotation of subunit density in the VP5-VP19C penton relative to the VP26− penton. The maps are color coded according to the particle radius, as indicated by the color bars.

