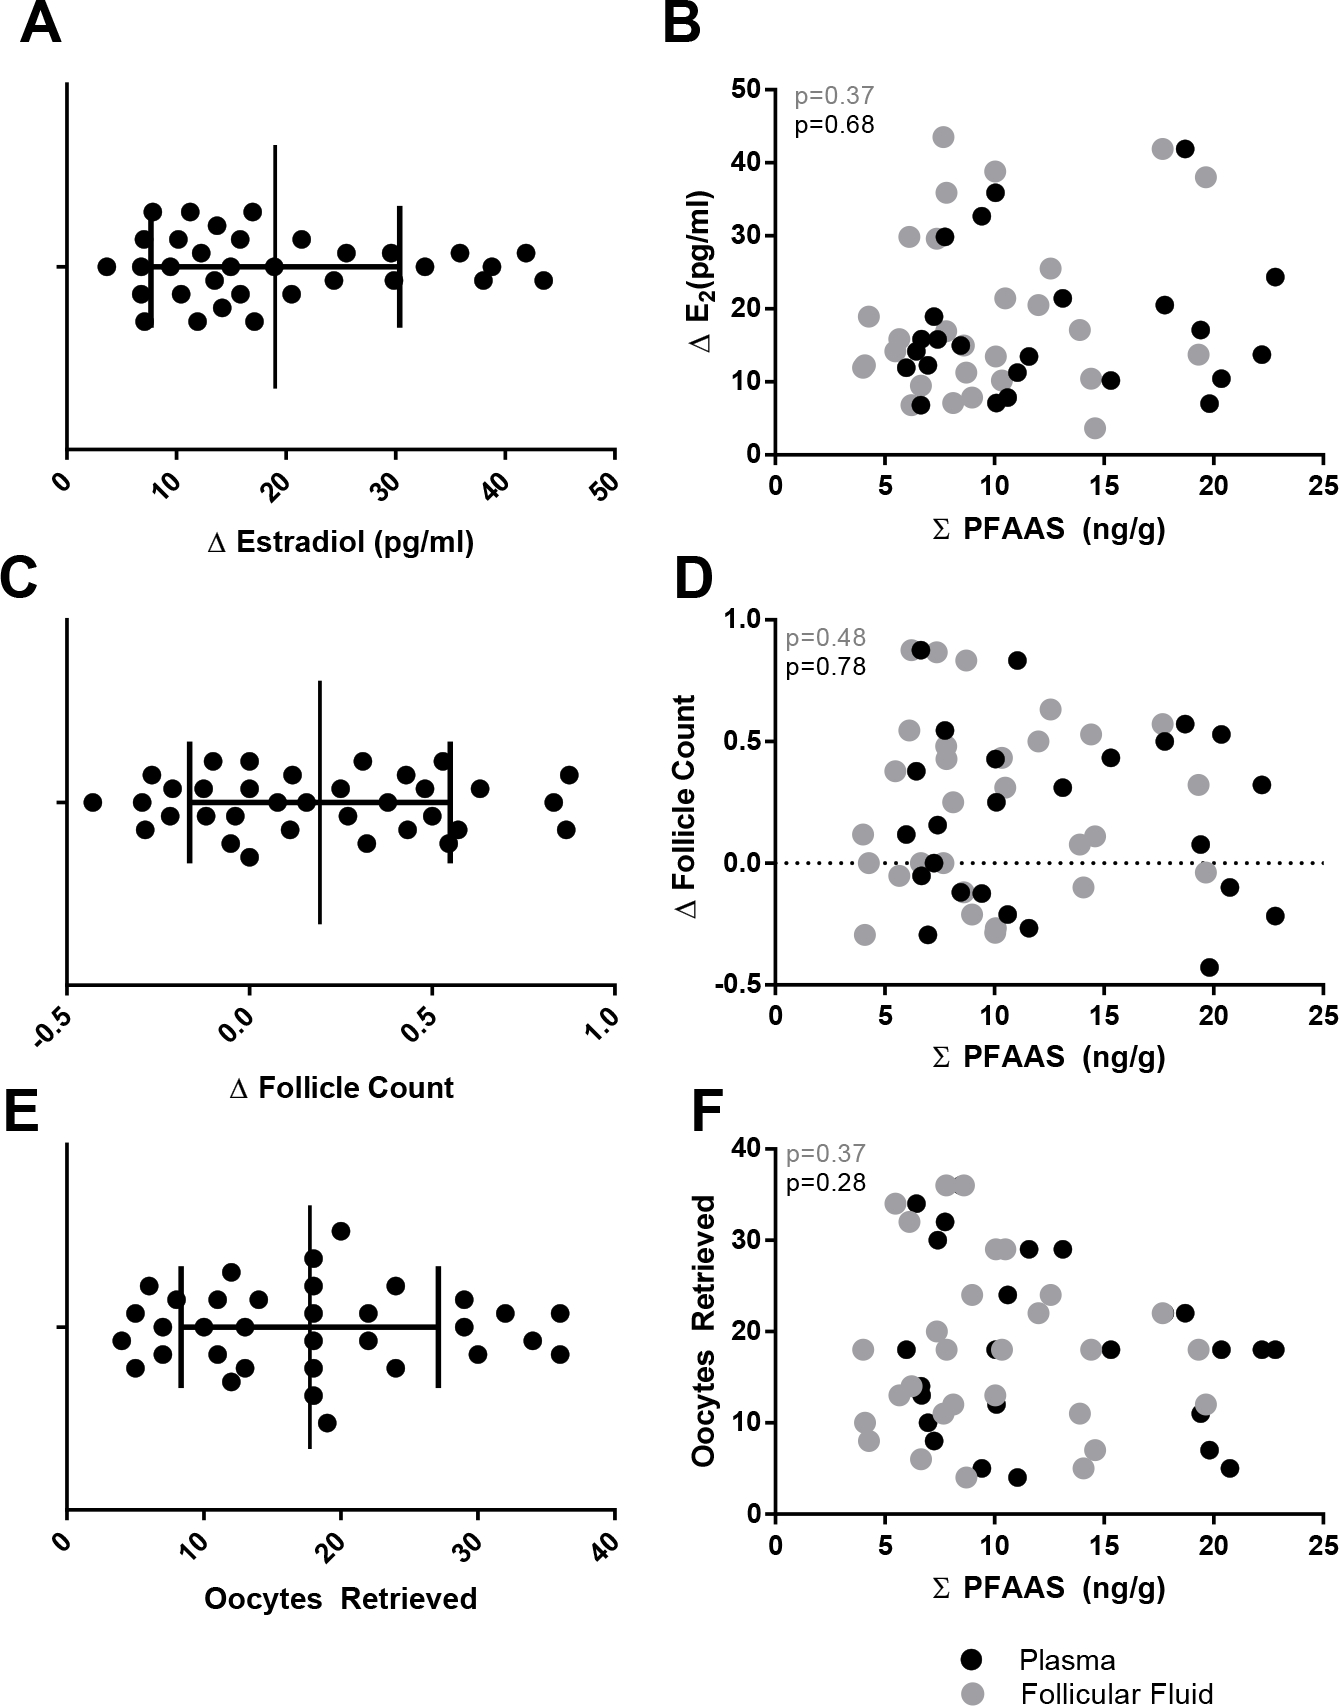
Figure 4.

Ovarian response measures related to total PFAA concentrations (ng/g). The range of observed ovarian responsiveness for three different response measures is displayed in panels A, C, and E. The relationship between ovarian responsiveness and total PFAA concentrations (ng/g) are depicted in panels B, D, and F. Plasma (black circles) and follicular fluid (gray circles) are depicted along with significance values (p) obtained from partial correlation analysis.
