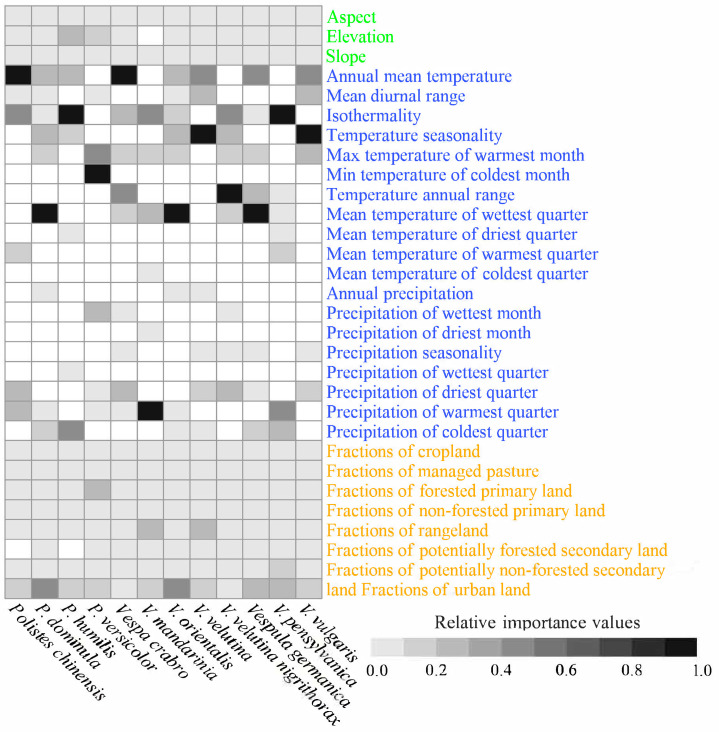
Figure 2.
The importance of each predictor in the baseline models. Topographical, climatic, and land-use factors are shown in green, blue, and orange fonts, respectively. For each species, importance values were standardized according to the max–min method. The grayscale shading indicates the relative importance of each of the predictors, and the blanks indicate that the predictors were not inputted into the final models for the species.

