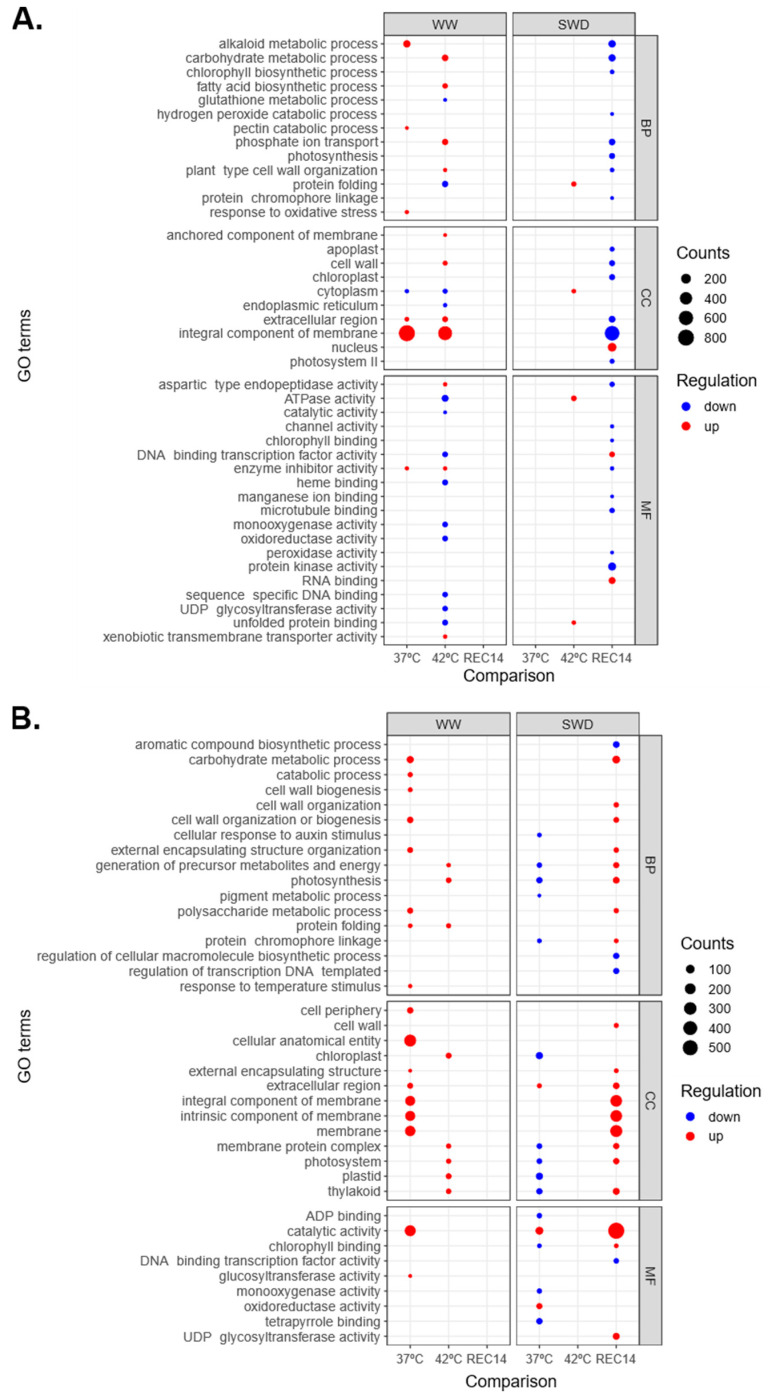
Figure 4.
Over-representation analysis of Gene Ontology (GO) terms performed with gProfiler against functional annotations in Icatu (A) and CL153 (B). GO terms are grouped by main category—Biological Process (BP), Molecular Function (MF), and Cellular Component (CC). Counts (size) indicate the number of DEGs annotated with each GO term, and dots are colored by the adjusted p-value (red: up-regulated DEGs; blue: down-regulated DEG). Treatments are as explained in Figure 2.

