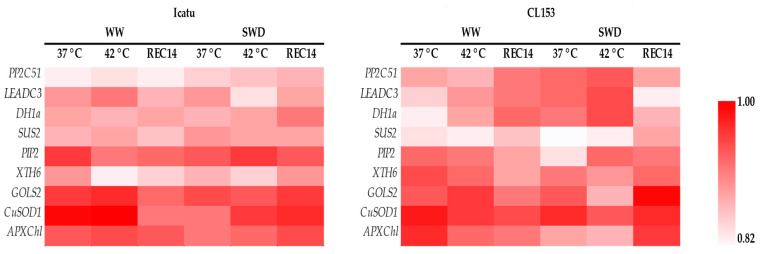
Figure 5.
Correlation results between RNA-seq data and qRT–PCR expression levels considering the following selected genes: PP2C51, protein phosphatase 2C 51-like; LEADC3, late embryogenesis abundant protein Dc3-like; DH1a, dehydrin DH1a; SUS2, sucrose synthase 2-like; PIP2-2, aquaporin PIP2-2-like; XTH6, xyloglucan endotransglucosylase/hydrolase protein 6; GOLS2, galactinol synthase 2-like; CuSOD1, superoxide dismutase [Cu-Zn]; APXChl, chloroplast ascorbate peroxidase.

