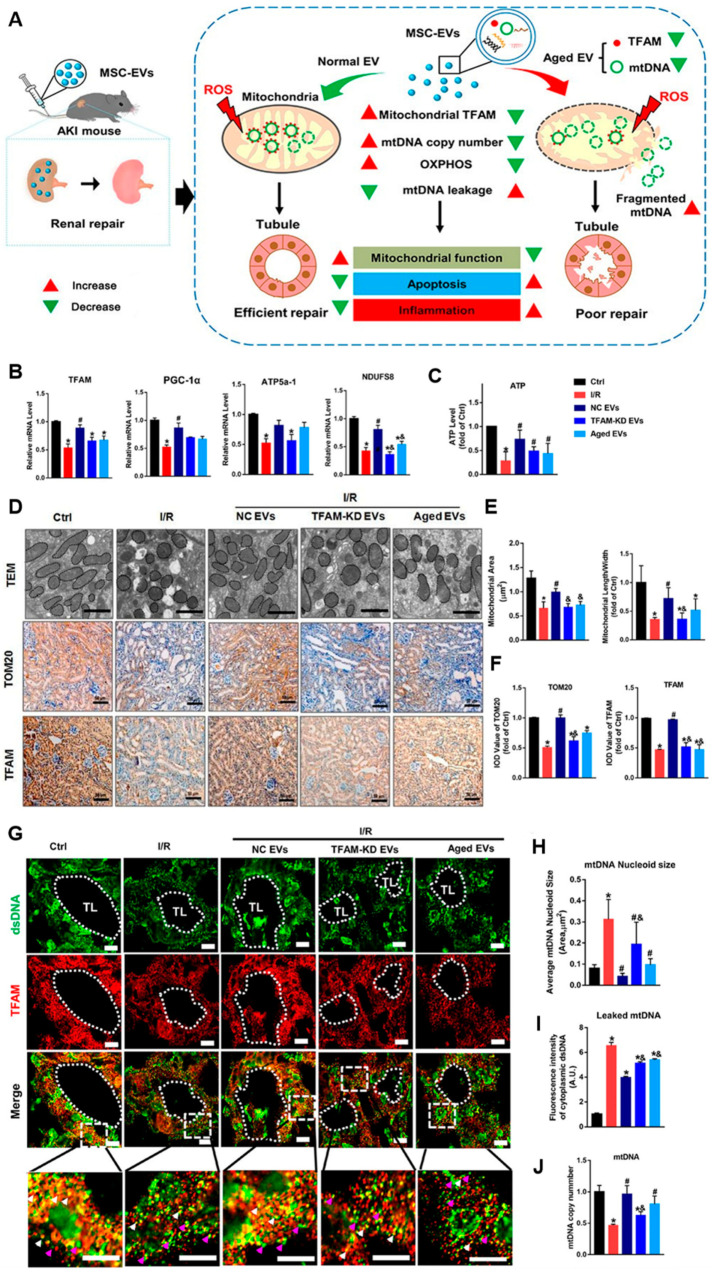
Figure 4.
MSC-EVs attenuated renal mitochondrial and mtDNA damage after acute kidney injury (AKI) [122]. (A) MSC-derived exosomes attenuate mitochondrial damage and inflammation by stabilizing mitochondrial DNA. (B) TFAM, PGC-1α, NDUFS8, and ATP5a1 mRNA levels in the mouse kidneys on day 3 after AKI (n = 6; * p < 0.05 vs. Ctrl group; # p < 0.05 vs. I/R group; & p < 0.05 vs. NC EV group). (C) ATP production in the mouse kidneys (n = 6; * p < 0.05 vs. Ctrl group; # p < 0.05 vs. I/R group). (D) Representative TEM images (scale bar = 2 μm) and micrographs of TOM20 and TFAM IHC staining in kidneys of mice (scale bar = 50 μm). (E) Mitochondrial areas and mitochondrial length/width ratio in TEM images (* p < 0.05 vs. Ctrl group; # p < 0.05 vs. I/R group; & p < 0.05 vs. NC EV group). (F) Quantification of TOM20 and TFAM protein expression in the kidneys detected using IHC staining (n = 6; * p < 0.05 vs. Ctrl group; # p < 0.05 vs. I/R group; & p < 0.05 vs. NC EV group). (G) Representative micrographs of TFAM and dsDNA costaining in mouse renal tubules on day 3 after surgery. The mice with I/R injury received intravenous EV injections (∼6.96 × 10¹⁰ particles/mouse) (scale bar = 20 μm). Renal tubular lumen (TL), normal mtDNA nucleoid (white arrowheads), and leaked mtDNA (dsDNA that was not colocalized with TFAM, pink arrowheads) were labeled. (H) The average size of mtDNA nucleoids in the renal tubules detected using IF staining (n = 10; * p < 0.05 vs. Ctrl group; # p < 0.05 vs. I/R group; & p < 0.05 vs. NC EV group). (I) Quantification of the leaked mtDNA intensity (n = 10; * p < 0.05 vs. Ctrl group; & p < 0.05 vs. NC EV group). (J) mtDNA copy number in kidneys of mice (* p < 0.05 vs. Ctrl group; # p < 0.05 vs. I/R group; & p < 0.05 vs. NC EV group).

