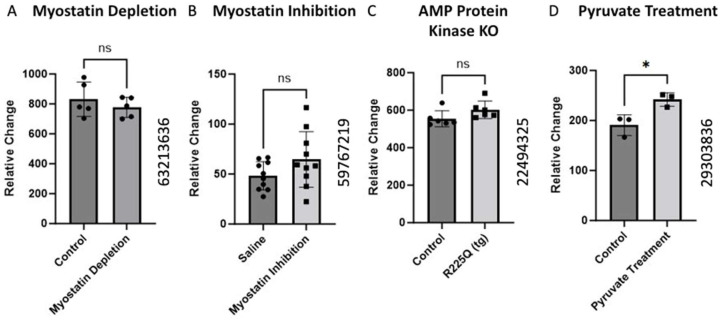
Figure 4.
Alteration of BCKDK gene expression following interruption in normal metabolic activity. The data for (A) were retrieved from GEO dataset using a Mus Musculus model uploaded by Welle et al. (GEO ID 63213636) (n = 5) [37]. (B) BCKDK gene expression assessed using skeletal muscle biopsises from Mus Musculus with inhibited myostatin activity. The data for (B) were retrieved from GEO dataset (GEO ID 59767219) (n = 10). (C) BCKDK gene expression assessed using skeletal muscle biopsies from transgenic Mus Musculus model with AMP Protein Kinase gene knockout compared with healthy controls. The data for (C) were retrieved from GEO dataset uploaded by Nilsson et al. (GEO ID 22494325) (n = 6) [38]. The data for (D) corresponds to research in a Mus Musculus model in which muscle cells from a pyruvate supplementation group were compared to controls. The data were retrieved from work uploaded by Wilson et al. (GEO ID 29303836) significance determined by GEO2R adjusted * p-value < 0.05 (n = 3) [39].

