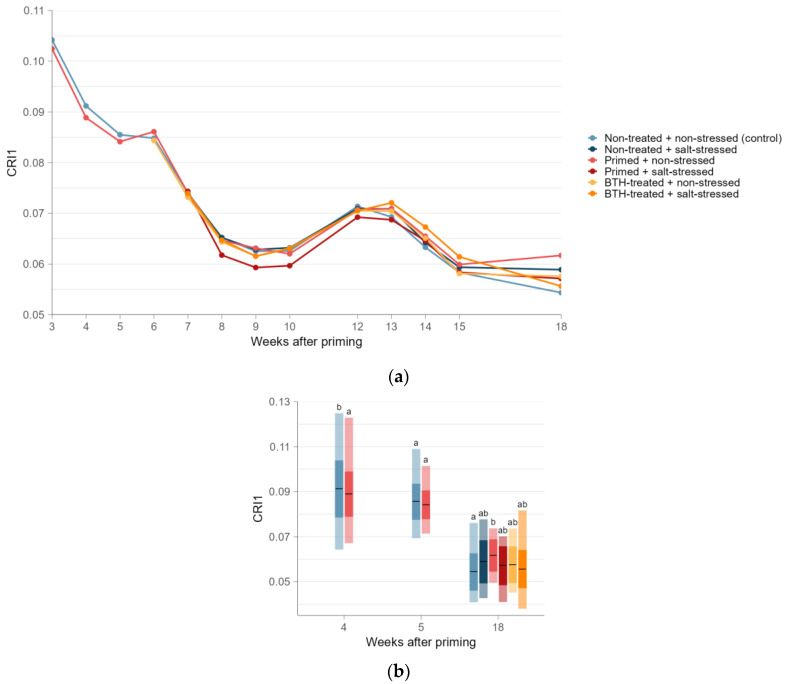
Figure A3.
CRI1 of young and mature tomato leaves, displayed by (a) trend lines representing means specific to each treatment week after priming and (b) mean (black horizonal line), standard deviation (intensely colored inner box), and maximum and minimum (lightly colored outer box) weeks after priming, differentiated for the six treatments (from left to right): non-treated and non-stressed (control; light blue), non-treated and salt-stressed (dark blue), primed and non-stressed (light red), primed and salt-stressed (dark red), BTH-treated and non-stressed (yellow), and BTH-treated and salt-stressed (orange). The different letters indicate significant differences (ANOVA and EMMs post hoc; α = 0.05) between groups at the same week after priming. The sample size per treatment was as follows: n = 191 (non-primed)/n = 96 (primed) at 3 WAP, n = 384 (non-primed)/n = 192 (primed) at 4 WAP, n = 256 (non-primed)/n = 127 (primed) at 5 WAP, n = 64 (non-primed and BTH-treated)/n = 63 (primed) at 6 WAP, and n = 32 from 7 WAP for all treatments.

