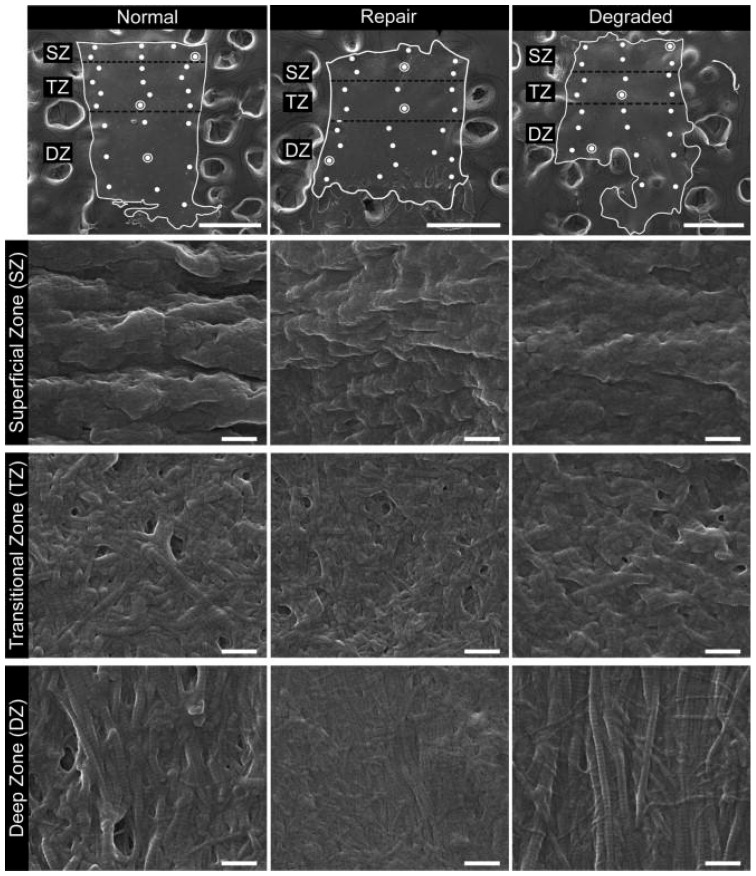
Figure 8.
Examples of SEM images for normal, repaired, and degraded cartilages from the superficial, transitional and deep zones. The top row contains the low magnification (80×) SEM images (scale bars are 500 μm) with the non-calcified tissue outlined in white and surrounded by carbon substrate. Zones are identified (SZ, TZ, DZ) as well as the sites where high-magnification images were captured (•). Subsequent rows contain one high-magnification (80,000×) image per zone per cartilage type, and the location from which each image was captured is identified by (⦿) on the corresponding low-magnification image. Scale bars are 500 μm and 500 nm for low and high-magnification images, respectively [31].

