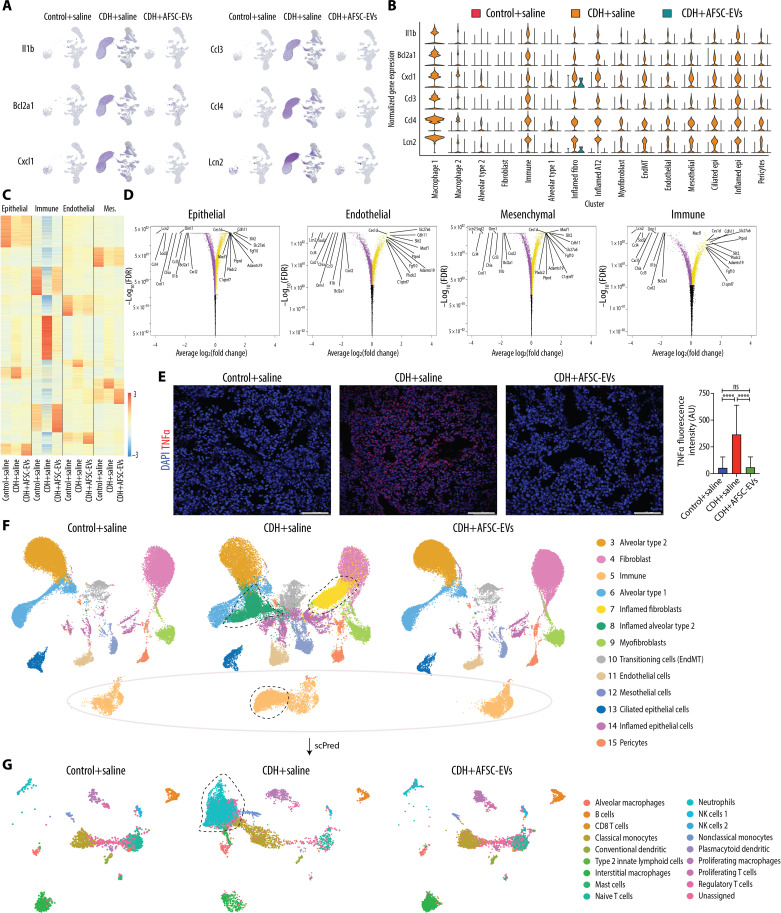
Fig. 5. CDH fetal lungs have a multilineage inflammatory signature that is dampened by the administration of AFSC-EVs.
(A) Featureplot of snRNA-seq data split by condition for six inflammatory genes with high expression in CDH+saline lungs. (B) Violin plot of inflammatory signature genes expression split by condition across cell types, as measured by snRNA-seq. (C) Heatmap displaying differential gene expression by major cell type, showing expression all genes ranked by log2(fold change) and P-adjusted < 0.05 within all conditions. (D) Volcano plots indicating most statistically significant differentially expressed genes by major cell type between CDH+saline-treated and CDH+AFSC-EV–treated groups. FDR, false discovery rate. (E) Representative immunofluorescence images of inflammation marker TNFα in rat fetal lungs from all three conditions, quantified as density per mm2. Scale bars, 50 μm. Control+saline (n = 5), CDH+saline (n = 5), and CDH+AFSC-EV (n = 5). AU, arbitrary units. ****P < 0.0001. (F) UMAP of a subset of data that excludes clusters 1 and 2 (overrepresented in CDH+saline group) split by condition. Outlines indicate nuclei or clusters that are represented in CDH+saline group compared to Control+saline and CDH+AFSC-EV groups. Control+saline (n = 30,064), CDH+saline (n = 45,114), and CDH+AFSC-EV (n = 42,193). (G) UMAP of predicted cell types contained in cluster 5 immune cells from (F), generated by machine learning algorithm (scPred) trained on rat adult lungs. Groups were compared using Kruskal-Wallis (post hoc Dunn’s nonparametric comparison) for (E), according to Shapiro-Wilk normality test.

