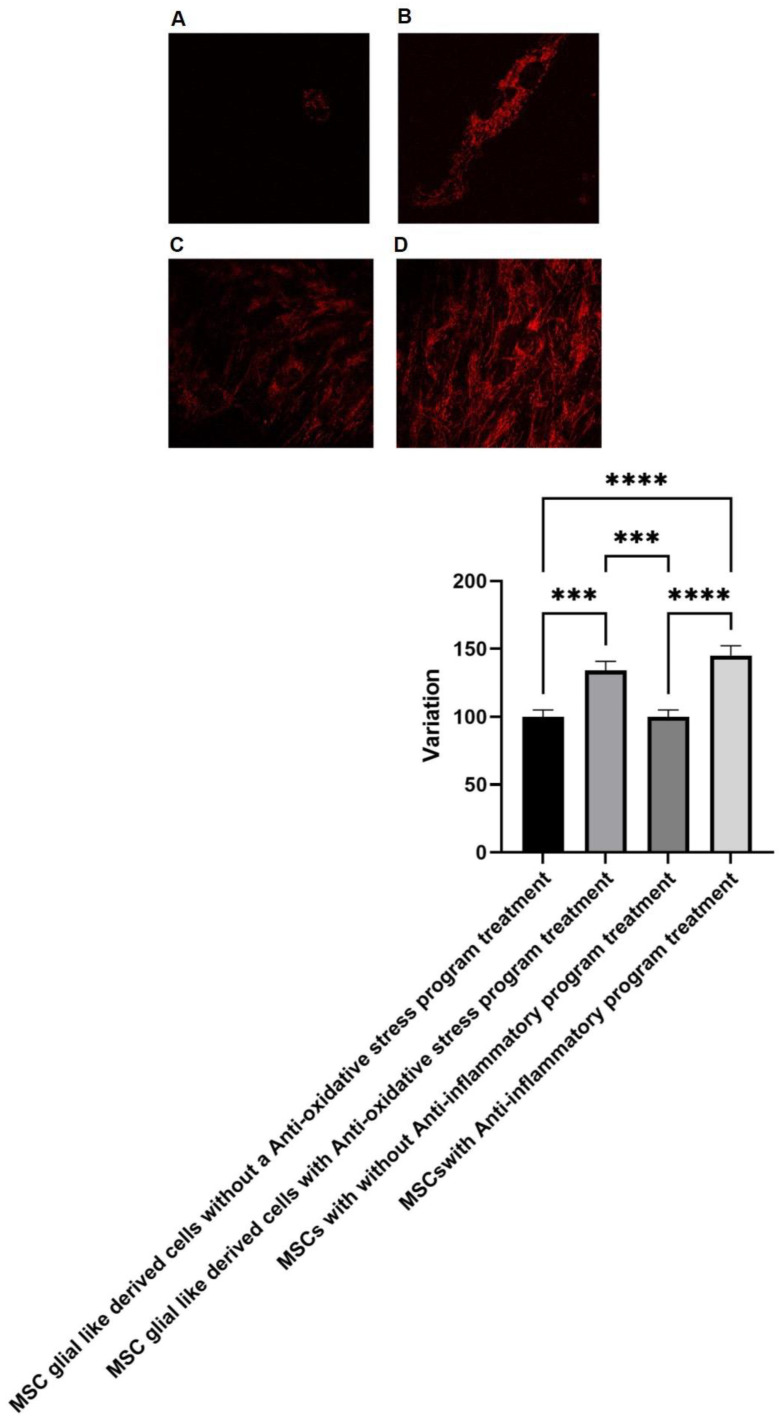
Figure 5.
Mitochondrial membrane potential. (A) Representative images of MSC-derived glial-like cells without and (B) with antioxidative stress program treatment. (C) Representative images of MSCs without and (D) with anti-inflammatory program treatment. The absence of treatment is our negative control (*** p value ≤ 0.01, **** p value ≤ 0.005).

