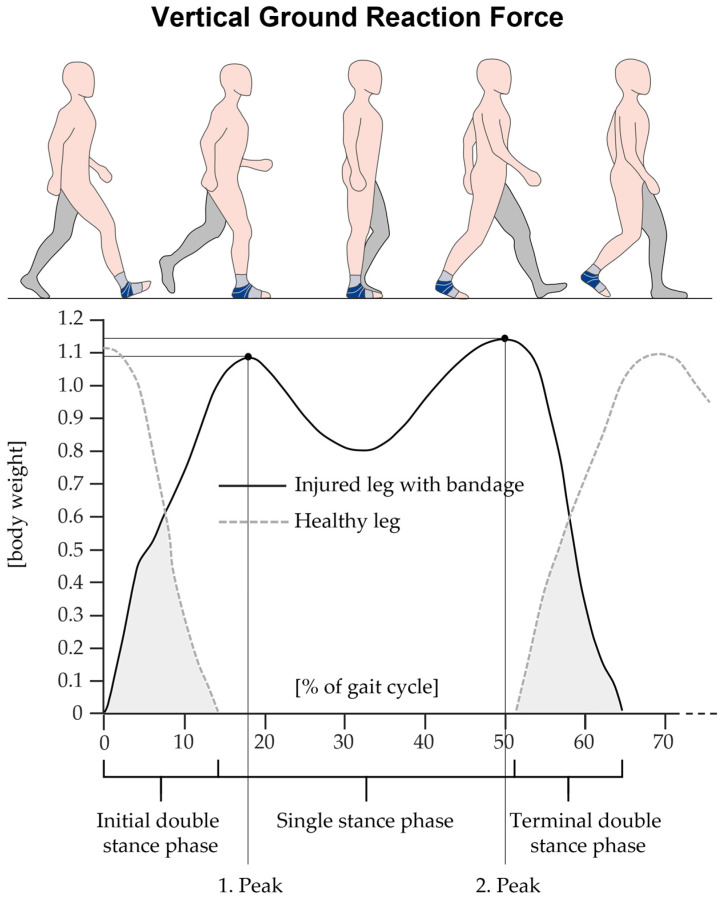
Figure 2.
Illustration of an actual vertical ground reaction force curve during walking from a random subject. The black solid line indicates the curve of the ground reaction force for the injured leg with a bandage, while the grey dashed line indicates the curve for the healthy leg. Shown are the first peak, corresponding to the loading response, and the second peak, corresponding to the terminal stance phase of the gait cycle [49]. The illustration also displays the relative duration of the single stance phase and both double stance phases (grey area). Note that for the statistical analysis, the relative double stance phase is the sum of both the initial and terminal double stance phases.

