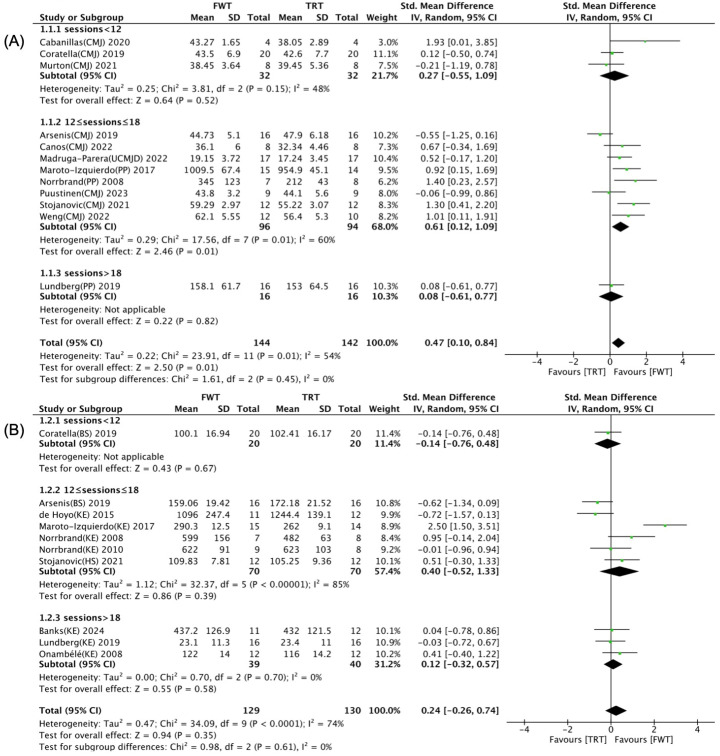
Figure 8.
Forest plot with subgroup analysis of total number of training sessions [35,36,37,38,39,40,41,42,43,44,45,46,47,48,49,50]. (A) Effect of total number of training sessions on muscle power. (B) Effect of total number of training sessions on maximal muscle strength.  effect size of individual studies.
  combined effect size.

