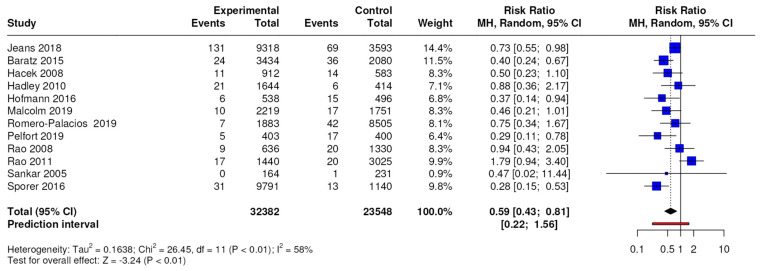
Figure 2.
Forest plots for total periprosthetic joint infection; CI = confidence interval, MD = mean difference, p = p-value. The results of the meta-analysis conducted on 11 studies with a level of evidence of 3 showed differences in terms of the number of MSSA-positive periprosthetic joint infections with an RR of 0.33 (95% CI, 0.23 to 0.47; p < 0.0001).

