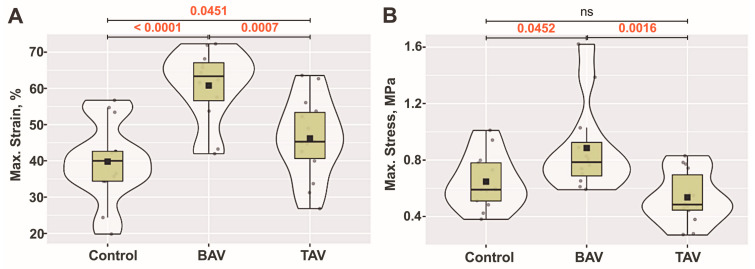
Figure 1.
Reflection of maximal strain and stress in the AscAo wall: (A) Maximal strain (%) for the samples in all groups. (B) Maximal stress (MPa) for the samples in all groups. The violin plot represents the shape of the variance of the variable, the box plot shows the median with IQR, and the black square represents the arithmetic mean. Kruskal–Wallis (KW) statistic: (A) Chi2 = 15.55, pKW < 0.001; (B) Chi2 = 11.43, pKW = 0.003; numbers in red indicate significant p-values (pDSCF) of Dwass–Steel–Critchlow–Fligner pairwise comparisons as a post-hoc test.

