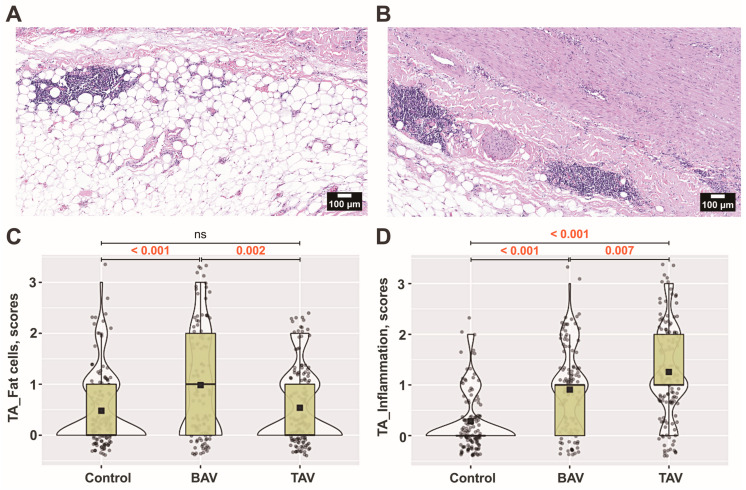
Figure 7.
The microcomposition of the tunica adventitia (TA) layer. The presence of adipocytes and loci with inflammatory cells in the aortic wall of (A) bicuspid aortic valve (BAV) patients and (B) tricuspid aortic valve (TAV) patients, as defined by hematoxylin and eosin staining (original magnification × 100, scale bar 100 µm). The numerical values of their semiquantitative assessment presented as scores of (C) fat cells and (D) inflammation in the TA layer including all (n × 10) visual fields for each group. The violin plot represents the shape of the variance in the variable, the box plot shows the median with the interquartile range (IQR), and the black square represents the arithmetic mean. Kruskal–Wallis (KW) statistic (C) Chi2 = 18.9, pKW < 0.001; (D) Chi2 = 93.1, pKW < 0.001; numbers in red indicate significant p-values (pDSCF) of Dwass–Steel–Critchlow–Fligner pairwise comparisons as a post-hoc test.

