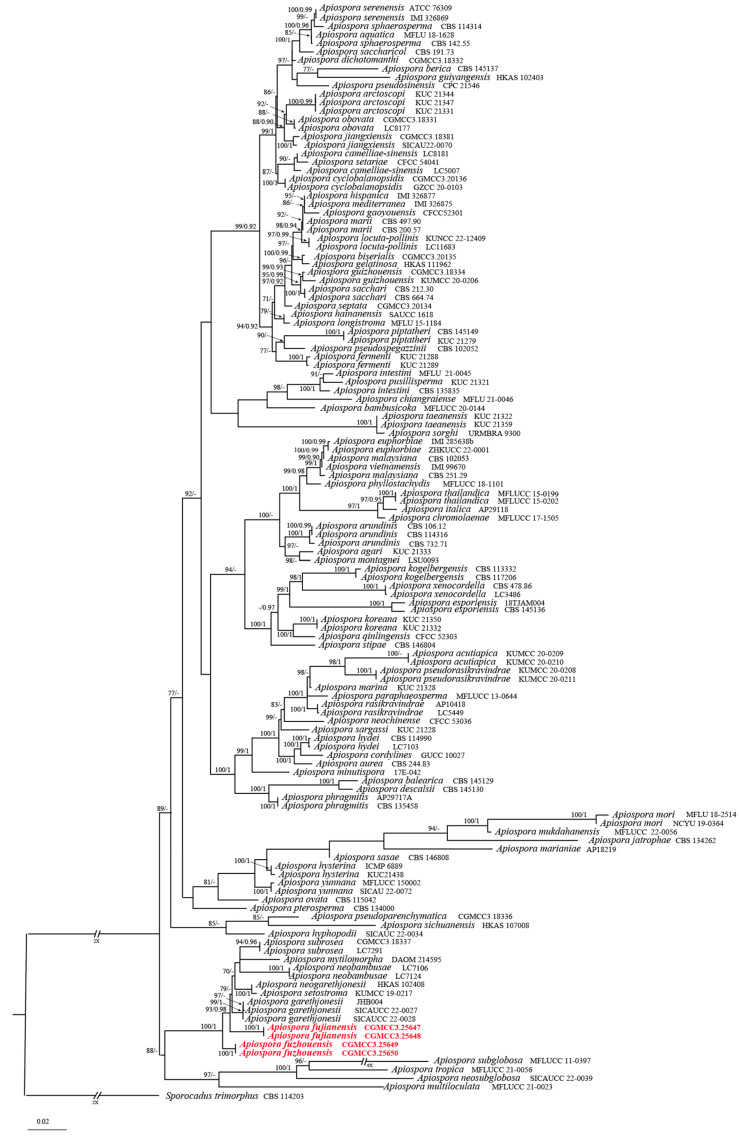
Figure 2.
Phylogram of Apiospora based on combined ITS, LSU, tef1-α, and tub2 genes. ML bootstrap support values (ML-BS ≥ 70%) and Bayesian posterior probability (BYPP ≥ 0.90) are shown as first and second position above nodes, respectively. Strains from this study are shown in red. Some branches were shortened according to the indicated multipliers.

