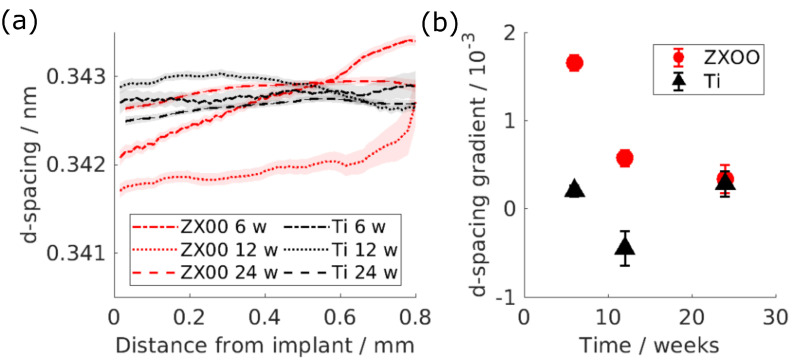
Figure 4.
(a) Lattice spacing of the HAp as a function of the distance from the implant interface: red is ZX00, black is Ti. The lines represent the mean values, while the shades represent the 95% confidence interval. (b) The gradient of the line fitted to the d-spacing as a function of the distance up to 0.8 mm from the implant interface. The error bars indicate the 95% confidence interval of the fit.

