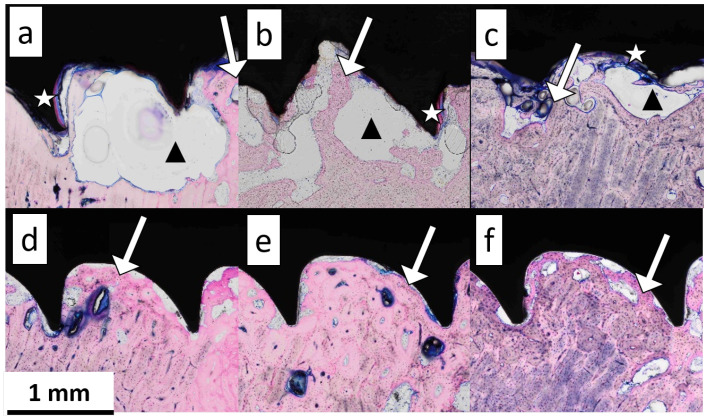
Figure 9.
The stained sections of the ZX00 sample after six (a), 12 (b), and 24 weeks (c) and Ti after six (d), 12 (e), and 24 weeks (f). The white stars show the degradation layer, the black triangles show the void area potentially containing gas, and the white arrows point at the newly formed bone tissue.

