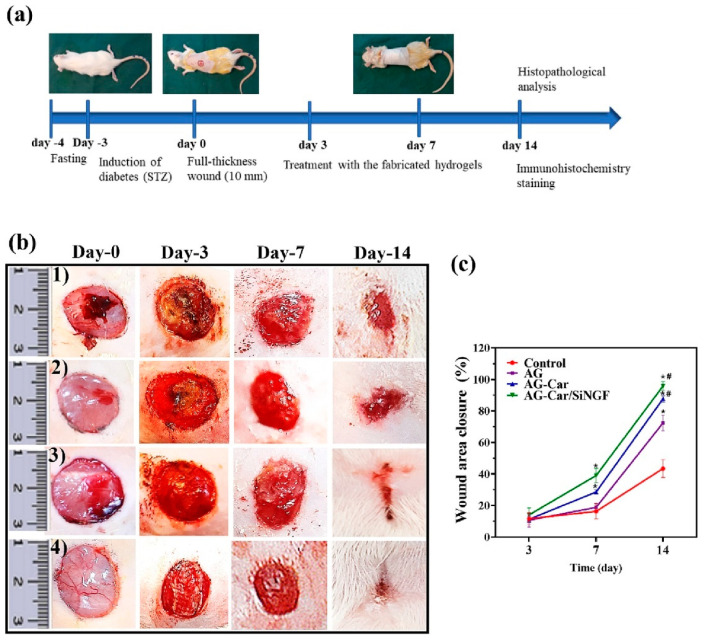
Figure 2.
The evaluation of the wound-healing effects of hydrogels in STZ-induced diabetic rats. (a) A schematic illustration of the experiments. (b) The morphology of wounds treated with the hydrogels at different time points (0, 3, 7, and 14 days) during DFU healing. Untreated (control) group (1), AG hydrogel group (2), AG-Car hydrogel group (3), and AG-Car/SiNGF hydrogel group (4). (c) A graphical representation of the wound closure area measured using Image J software (V 1.8.0) (* p < 0.05, compared with control group; # p < 0.05, compared with control and AG hydrogel groups) [24].

