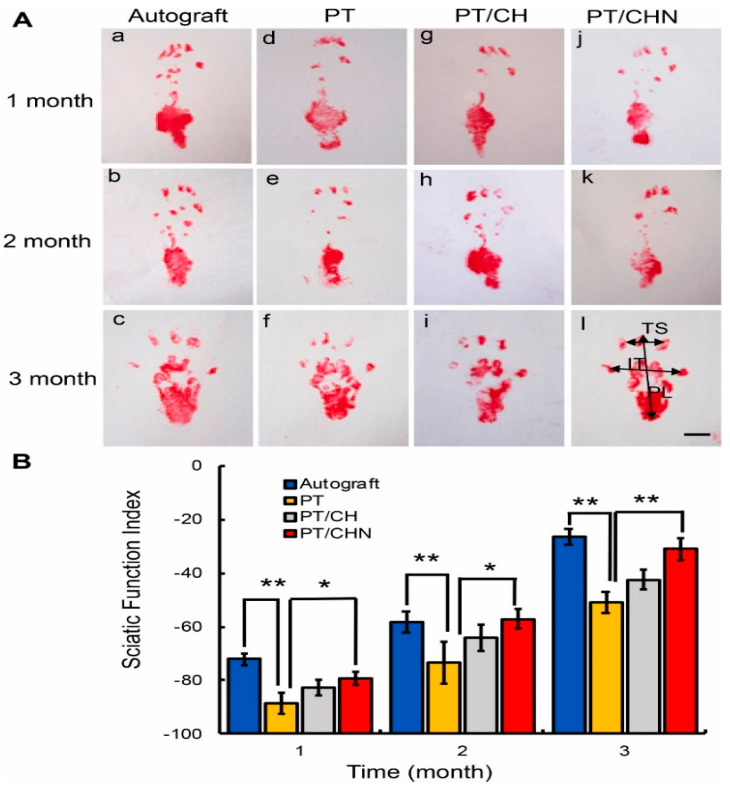
Figure 3.
Walking track analyses in vivo. (A): Footprint collected on the walking track at different time points (1, 2, and 3 months after implantation): first column: autograft group; second column: PT group; third column: PT/CH group; fourth column: PT/CHN group. Scale bar, 5 mm. (B): SFIs calculated at different time points (1, 2, 3 months after implantation) * p < 0.05, ** p < 0.01 [26].

