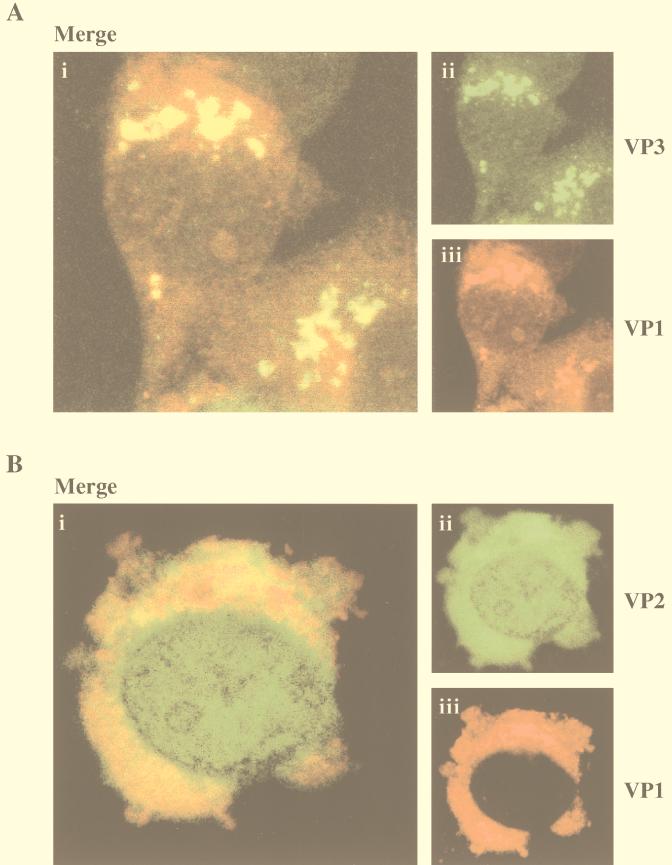
FIG. 8.
(A) Colocalization of VP1 and VP3 in cells coinfected with VT7/VP1 and VT7/VP3. Coinfected cells were fixed and incubated with rat anti-VP1 and rabbit anti-VP3 antisera. Thereafter, cells were incubated with goat anti-rat Ig antibodies conjugated to TXRD and with a goat anti-rabbit Ig conjugated to FITC as described in Materials and Methods. Green FITC (VP3) and red TXRD (VP1) fluorescence signals were recorded separately by using appropriate filters. Panel i shows, in yellow, the overlay of the VP3 and VP1 fluorescent signals. Panels ii and iii show the VP3 and VP1 signals, respectively. (B) Colocalization of VP1 and VP2 in cells coinfected with VT7/VP1 and VT7/VP2. Coinfected cells were fixed and incubated with rat anti-VP1 and rabbit anti-VP2/VPX antisera. Thereafter, cells were incubated with goat anti-rat Ig antibodies conjugated to TXRD and with a goat anti-rabbit Ig conjugated to FITC as described in Materials and Methods. Green FITC (VP2/VPX) and red TXRD (VP1) fluorescence signals were recorded separately by using appropriate filters. Panel i shows, in yellow, the overlay of the VP1 and VP2 fluorescent signals. Panels ii and iii show the VP2 and VP1 signals, respectively.

