Figure 2.
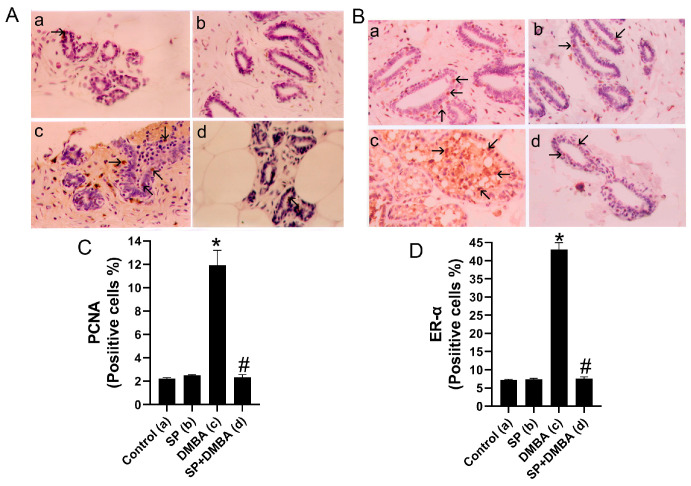
Figure displays immunohistochemical staining for PCNA and ER-α in breast sections, labeled as (A,B). Rats labeled as A and B were subjected to several treatments: (a) vehicle (as a control), SP (b), DMBA (c), and DMBA + SP (d) exhibiting PCNA- and ER-α-positive cell expressions in breast tissues. Photomicrographs and quantitative analysis (C,D) demonstrate the quantity of PCNA- and ER-α-positive cells The quantification of PCNA and ER-cells in each slice was conducted by enumerating the number of cells exhibiting brown staining positivity out of a total of 1000 cells seen at a magnification of 400×. Arrows indicate the presence of PCNA and ER-α-positive cells (H counter stained, 400×). Values expressed as mean ± SEM for six animals in each group. Significance was determined by one-way analysis of variance followed by a post hoc Dunnett’s test. * p < 0.05 vs. control group; # p < 0.05 vs. DMBA group.

