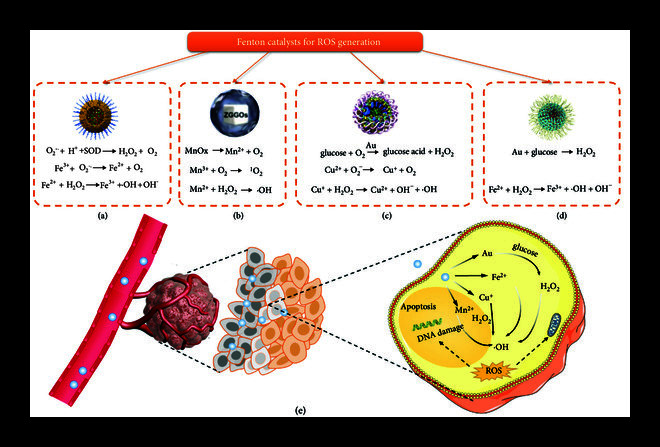
Figure 7.

Schematic diagram of delivering Fenton catalysts for tumor CDT therapy. (a) Schematic diagrams of the structure of the OVA-NCs and reaction formula of ROS generation. Reprinted with permission from Jiang et al. [136] Copyright 2020, Wiley-VCH GmbH. (b) Schematic diagrams of Mn3+-rich oxide/persistent luminescence nanoparticles and reaction formula of ROS generation. Reprinted with permission from Ding et al. [137] Copyright 2021, Ivyspring International Publisher. (c) Schematic diagrams of hollow mesoporous organosilica biocatalysis nanoreactor and reaction formula of ROS generation. Reprinted with permission from Li et al. [138] Copyright 2020, WILEY-VCH Verlag GmbH & Co. KGaA, Weinheim. (d) Schematic illustration biomimetic inorganic nanoplatform and reaction formula of ROS generation. Reprinted with permission from Gao et al. [54] Copyright 2019, T WILEY-VCH Verlag GmbH & Co. KGaA, Weinheim. (e) Schematic diagrams of the nanodelivery systems passively enriched in tumor tissues by the EPR effect, and Fenton or Fenton-like reactions occur inside the cells to induce cell apoptosis.
