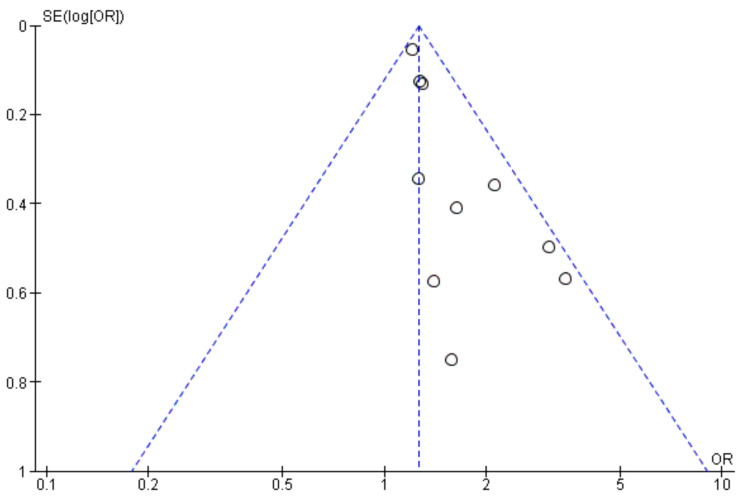
Figure 9.
Funnel plot of Odds Ratios (OR) and Standard Errors (SE) for male gender and SSI risk. The x-axis represents the odds ratio (OR), and the y-axis represents the standard error (SE) of the log-transformed OR. Each dot represents an individual study. The dashed lines represent the 95% confidence limits around the summary effect estimate. The asymmetry in the plot suggests potential publication bias.

