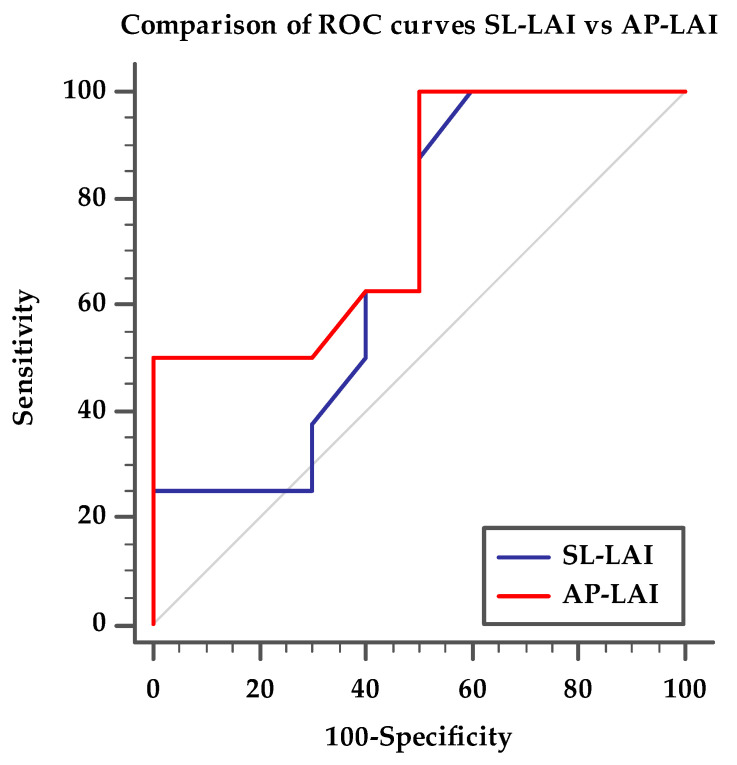
Figure 4.
Comparison of ROC curves for AP-LAI and SL-LAI, discriminating patients with optimal post-procedural result from patients with suboptimal post-procedural results. ROC curve for SL-LAI with AUC 0.675 (95% CI 0.42–0.87), ROC curve for AP-LAI with AUC 0.769 (95% CI 0.51–0.93, p < 0.05), p < 0.05 for ROC curve pairwise comparison.

