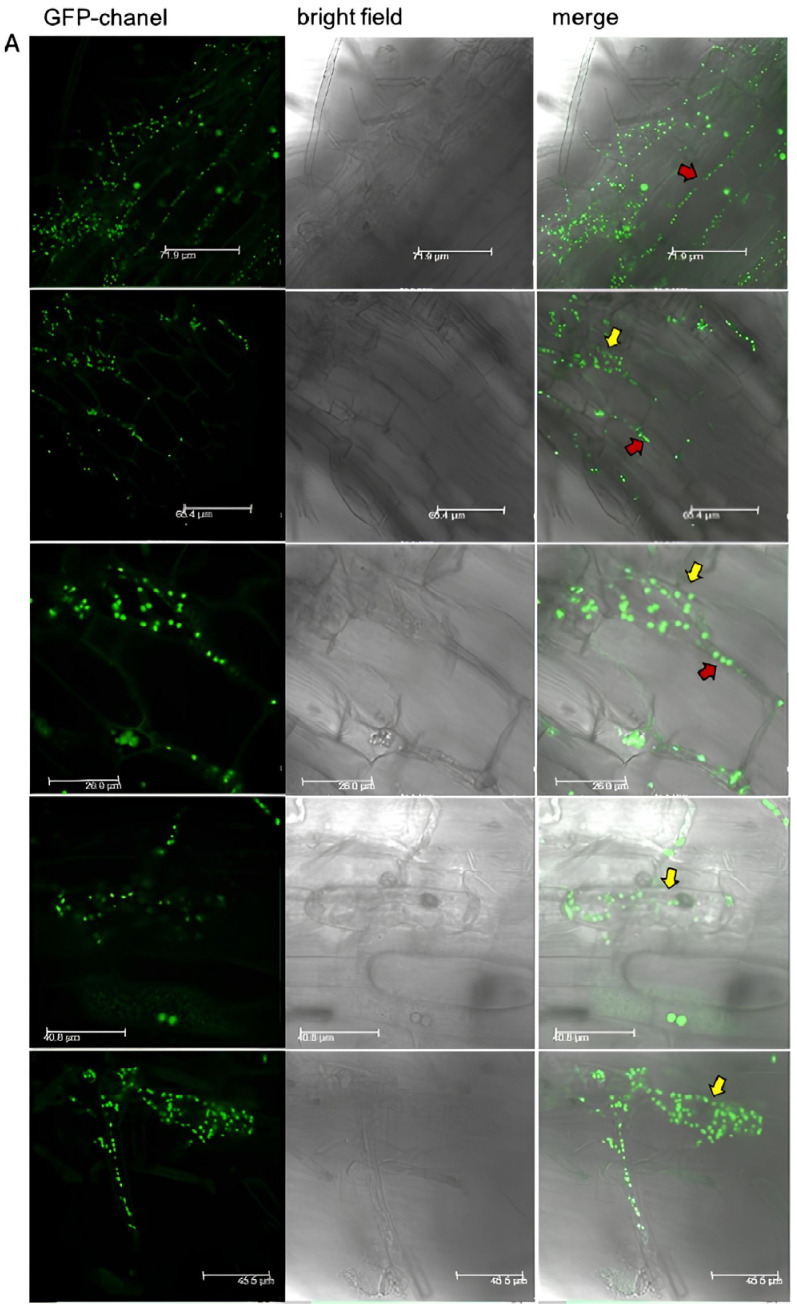
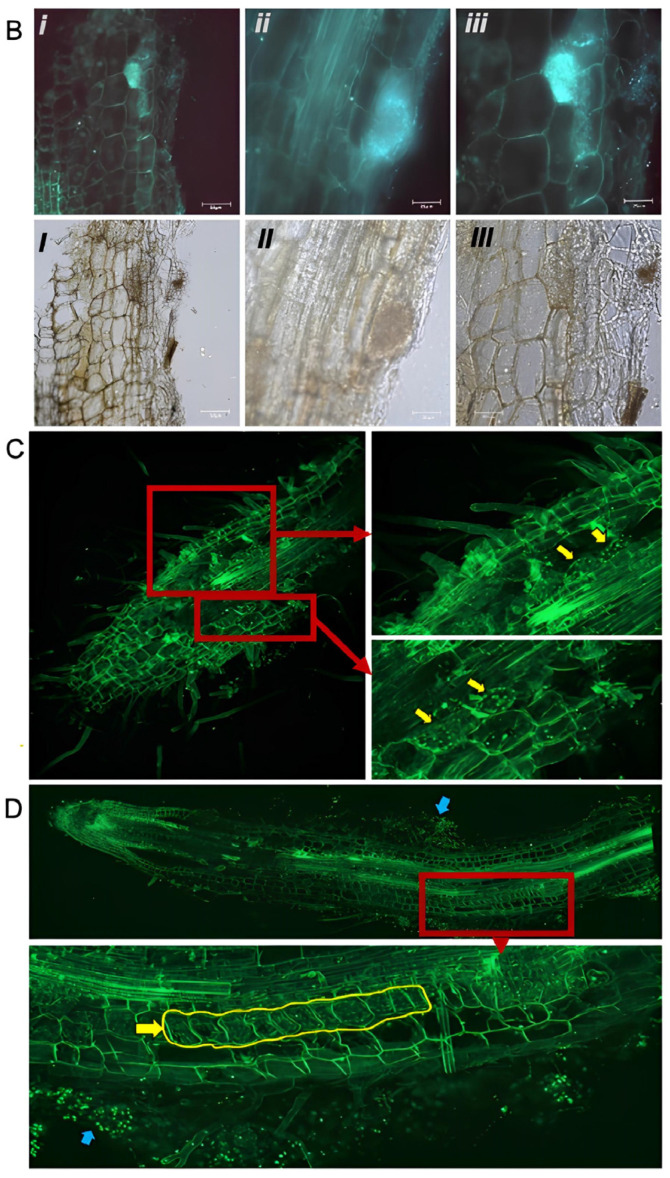
Figure 3.
Fluorescent images of longitudinal B. distachyon root sections co-cultivated with the N. crassa FGSC #9518 strain, expressing GFP-coupled histone1 protein. Additional green fluorescence results from the auto-fluorescing plant cell wall. (A) Confocal laser scanning images show apoplastic (red arrows) and subcellular (yellow arrows) growth of fungal hyphae. (B) Fluorescent microscopic images show N. crassa accumulation in single cortical plant cells. (i–iii) GFP channel, (I–III) corresponding brightfield images. (C,D) Spinning-disk confocal microscopy was used to present an overview of a larger root section area. Distinct sectors (depicted by red boxes) with invasive N. crassa growth (yellow arrows) are magnified. Blue arrows indicate the extensive hyphal network covering the root surface.


