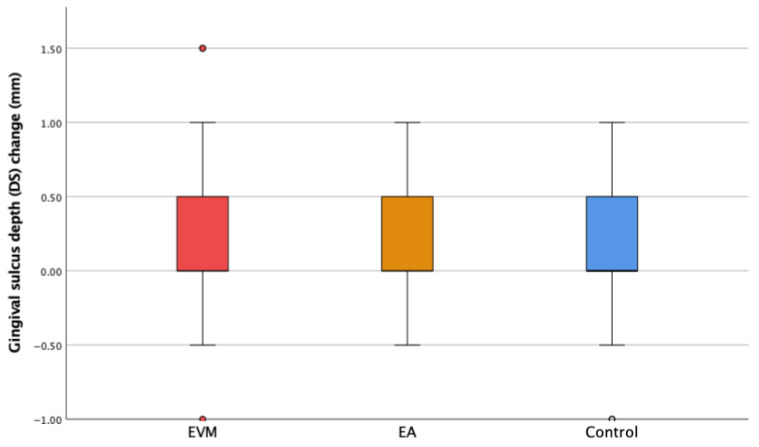
Figure 6.
The change in the sulcus depth (ΔDS) in the experimental groups (extruded teeth—EVM; adjacent teeth—EA) and the control group. ° Mild outliers: Values that are more than 1.5 × IQR below Q1 or above Q3 are represented by circles. SPSS gives us the case numbers for these values (white and red circle).

