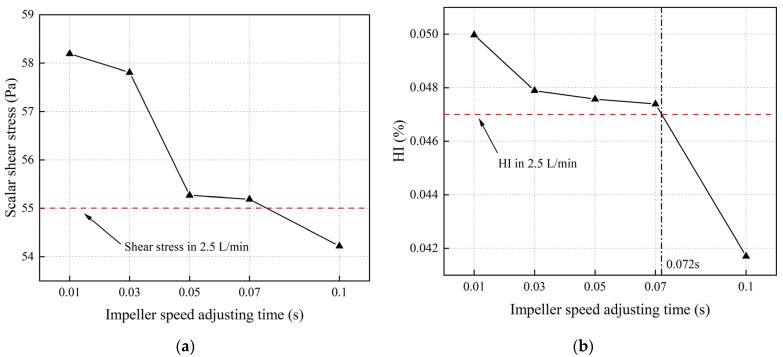
Figure 14.
Average scalar shear stress and hemolysis index on the radial cross section at the midpoint in the longitudinal direction of the blood pump during impeller speed variations at different time intervals (The red dashed line representing the average scalar shear stress on the cross section and the hemolysis index at the pump outlet with a flow rate of 2.5 L/min. The black dotted line represents the impeller speed adjusting interval that correspond to the same hemolysis index as at a stable flow rate of 2.5 L/min): (a) average scalar shear stress on the radial cross section; (b) hemolysis index on the radial cross section.

