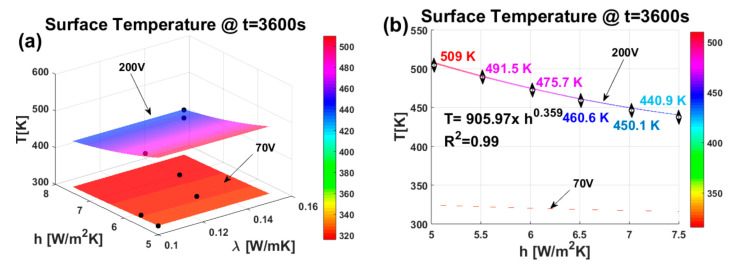
Figure 20.
(a) 3D response surface graphics (full quadratic model) for the temperature, depending on thermal conductivity and heat exchange coefficient. The black markers represent the experimental thermal data; (b) 2D view of the interpolating surfaces as a function of the exclusive heat exchange coefficient.

