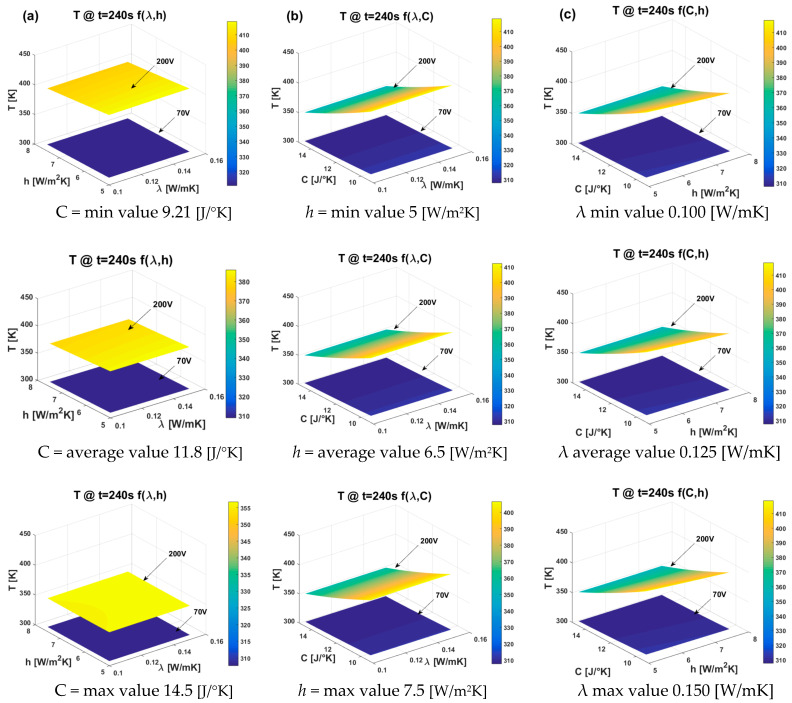
Figure 21.
Response surface graphics presenting the effect of the three thermal factors on the surface temperature value recorded at the time instance of 240 s, as follows: (a) effect of thermal conductivity and heat transfer coefficient, (b) effect of thermal conductivity and thermal capacity, and (c) effect of heat transfer coefficient and thermal capacity. In each plot, the unconsidered factor was held constant at its minimum, average, and maximum values (first, second, and third row, respectively).

